The U.S. deficit will shrink… and then explode
Basically, Democrats and Republicans are squabbling about all the wrong things
The moon rises behind the U.S. Capitol Dome in Washington as Congress works into the late evening, Sunday, Dec. 30, 2012 to resolve the stalemate over the pending “fiscal cliff.” (AP Photo/J. David Ake)
Share
There are two simple facts about the U.S. deficit that Congress and the media — for all the brouhaha about government debt these days — tend to ignore. The Congressional Budget Office highlighted those two things once again today in its annual forecast on the budget and the economy:
1. The U.S. deficit has been shrinking since 2009.
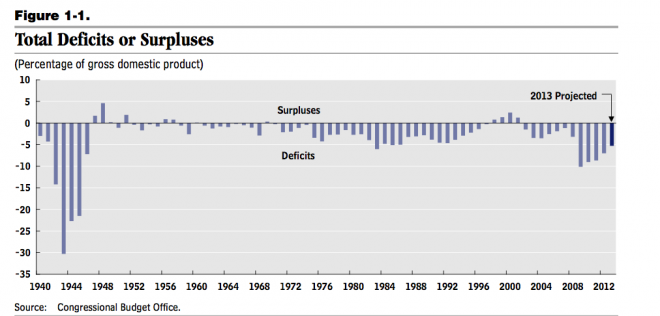
According to the CBO’s analysis, the deficit in 2013 will be $845 billion, or 5.3 per cent of GDP, which is roughly half the share of GDP it accounted for in 2009.
Now, the actual deficit in 2013 is likely to be larger than that, since CBO projections assume that the enormous spending cuts of the fiscal cliff will actually kick in, whereas it’s likely Congress will choose to cut less. (The cuts are currently set to take effect on March 1 and the CBO always makes its baseline forecasts based on what current law says, not what lawmakers are likely to do.)
That said, the deficit has been declining for the past three years, both in dollar terms and relative to the size of the economy. In 2009, the U.S. deficit was $1.4 trillion. In 2012 it was $1 trillion — still a mind-boggling figure but almost 30 per cent smaller than what it was three years earlier. As a percentage of GDP, last year’s deficit was seven per cent — again very high, but already three percentage points lower than in 2009.
In large part, this is simply a function of the recovering economy. As GDP started to expand, the deficit started to look smaller by comparison. As job growth picked up, more people started paying taxes (remember that job creation and unemployment don’t necessarily move together, as Stephen Gordon explains here). And as more people got pay raises, they started paying more taxes — in fact, the CBO expects that taxable incomes will rise faster than GDP for the next ten years or so.
Spending on unemployment insurance has also decreased: 8.7 million Americans were receiving benefits last year, down from 14.4 million in 2009. It’s hard to cheer those numbers, since joblessness is still so stubbornly high and many have lost their benefits without having found employment, but this safety net has, rightly or wrongly, started to withdraw, as it is designed to do.
The deficit ballooned in 2009 because the economy took a dive, but as growth picks up the hole in government coffers is set to shrink substantially in absolute and relative terms.
Evan Soltas calculated the size of the structural deficit (whatever remains once you disregard revenue and spending tied to the economy’s ups and downs) was $325 billion, or 2.1 percent of GDP, in 2012. That’s a whole lot less scary than $1 trillion or even $845 billion.
2. In a few years, the deficit will start rising again — but the tax hikes and spending cuts over which Democrats and Republicans are ripping each others’ hair out won’t make much of a difference.
The really scary story about the U.S. deficit is the one that looks at the medium and long term. After dipping to 2.4 per cent of GDP in 2015, the deficit will start rising again in 2016, reaching 3.8 per cent of GDP in 2023.
“Debt will rise sharply relative to GDP after 2023 and for decades thereafter,” writes the CBO.
Again, forget that the CBO is operating under the assumption Congress will cut spending by $110 million for ten years, and the deficit likely won’t decrease that fast. The underlying trend holds: the U.S. fiscal shortfall will dip for a few years and then climb back up really fast.
Why?
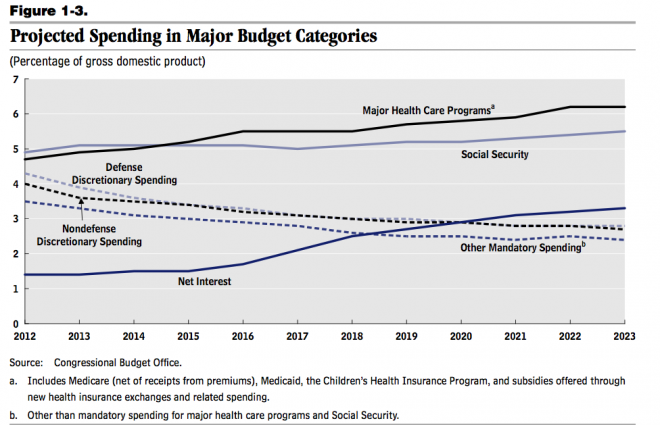
Because baby-boomers will start retiring en masse and health care costs in the U.S. are headed nowhere but up (and not just because older people are using more of it. Read more on that here). Together, population aging and ever pricier health care will cause spending on the major health care programs and Social Security to increase from around 10 percent of GDP today to nearly 16 percent of GDP 25 years down the road, according to the CBO’s long-term budget estimate.
In contrast, as the graphic above shows, discretionary spending — which in U.S. budget speak means almost anything other than Medicare, Medicaid and Social Security — is set to decline over the years as a share of GDP.
Unfortunately, the fiscal cliff/sequester spending cuts we always hear about — now looming in about three weeks — would mostly dig into U.S. discretionary spending.
Even in the highly unlikely case that Republicans and Democrats reach some kind of long-term deal on the fiscal policies they’re currently squabbling about, the real time-bomb for America’s finances will keep ticking.

