The case of the disappearing Statistics Canada data
The problem of missing and incomplete data at Statistics Canada goes far deeper than that botched labour report
The Statistics Canada offices at Tunney’s Pasture in Ottawa on Wednesday, May 1, 2013.Has Statistics Canada — renowned around the world for its ability to take snapshots of Canadian life — lost some of its zoom?The answer will come Wednesday, when the agency’s National Household Survey reveals how much critical information was lost in the controversial transition two years ago from a mandatory long-form census to a voluntary questionnaire. Sean Kilpatrick/CP
Share

The Great Statistics Canada 200-Jobs Mystery is generating loads of headlines, as it should. The botched labour report for July, which, initially, and erroneously, claimed Canada produced just 200 jobs that month, has once again sparked questions about the quality of Canada’s statistical data. (Revised figures are due Friday).
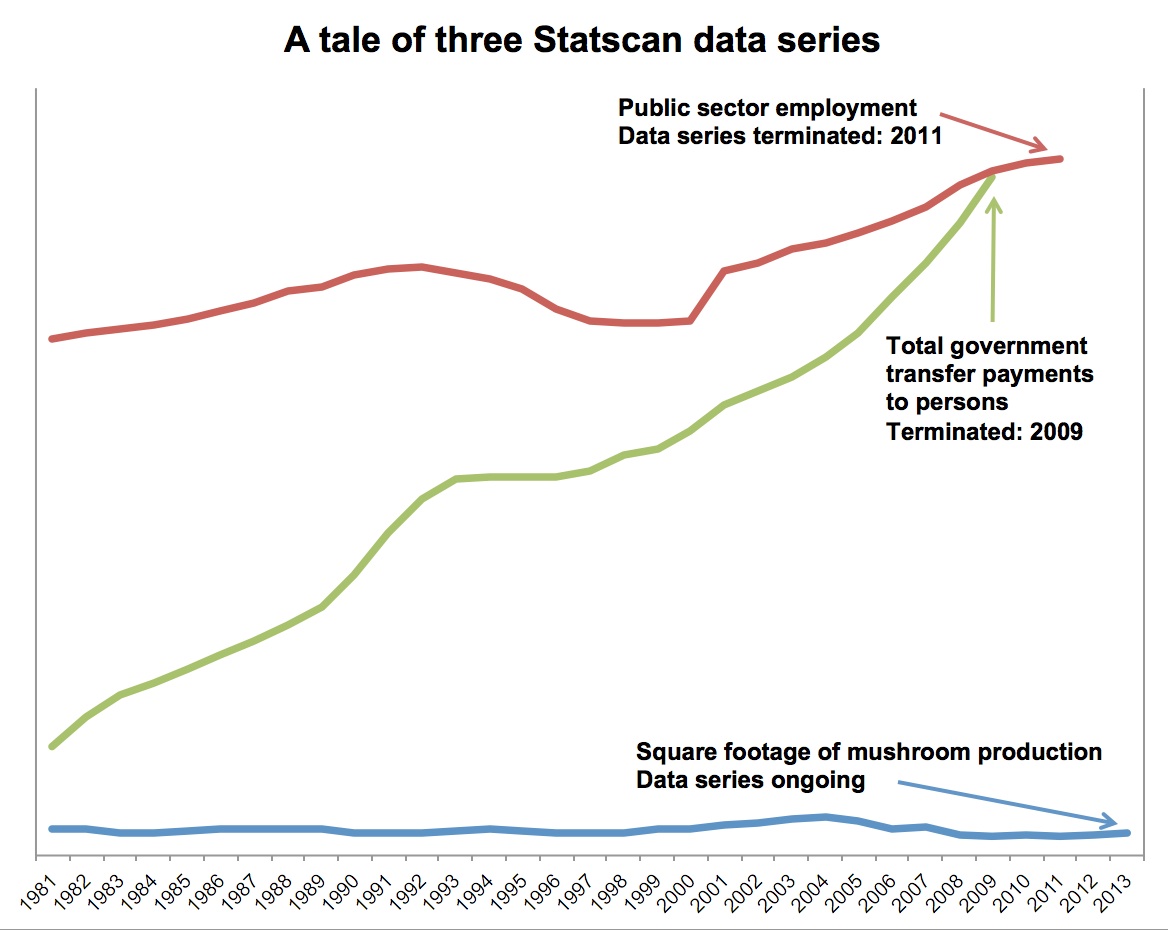
But this is far from the only thing troubling regular StatsCan users. I made the following chart to illustrate one of the great frustrations that journalists, economists and academics have with StatsCan. One minute, the agency, tasked with measuring the tick tock of the economy and society, tracks seemingly vital data (such as detailed breakdowns of public sector employment and wages by all levels of government, or the total value of government transfer payments to persons by province and type of transfer), the next, *poof*, they’re terminated.
Good thing StatsCan still tracks the square footage of fungi production.
Perhaps, buried somewhere deep in CANSIM—the agency’s socioeconomic database—there exist new data series that pick up where the above leave off, but I can’t find them.
Last year, Stephen Gordon railed against StatsCan’s attention deficit disorder, and its habit of arbitrarily terminating long-standing series and replacing them with new data that are not easily comparable.
For what appears to be no reason whatsover, StatsCan has taken a data table that went back to 1991 and split it up into two tables that span 1991-2001 and 2001-present. Even worse, the older data have been tossed into the vast and rapidly expanding swamp of terminated data tables that threatens to swallow the entire CANSIM site. A few months ago, someone looking for SEPH wage data would get the whole series. Now, you’ll get data going back to 2001 and have to already know (StatsCan won’t tell you) that there are older data hidden behind the “Beware of the Leopard” sign.
…
Statistics Canada must be the only statistical agency in the world where the average length of a data series gets shorter with the passage of time. Its habit of killing off time series, replacing them with new, “improved” definitions and not revising the old numbers is a continual source of frustration to Canadian macroeconomists.
Others are keeping tabs on the vanishing data. The Canadian Social Research Newsletter for March 2 referred to the cuts as the CANSIM Crash Diet and tallied some of the terminations:
For the category “Aboriginal peoples” : 4 tables terminated out of a total of 7
For the category “Children and youth” : 89 tables terminated out of a total of 130
For the category “Families, households and housing” : 67 tables terminated out of a total of 112
For the category “Government” : 62 tables terminated out of a total of 141
For the category “Income, pensions, spending and wealth” : 41 tables terminated out of a total of 167
For the category “Seniors” : 13 tables terminated out of a total of 30
As far as Statistics Canada’s troubles go, this will never get the same level of attention as the mystery of the 200 jobs. But, as it relates to the long-term reliability of Canadian data, it’s just as serious.
