The lessons for Justin Trudeau in his father’s first budget
As Canada readies for Justin Trudeau’s first budget, what can his father’s first budget tell us about the economies each Prime Minister inherited?
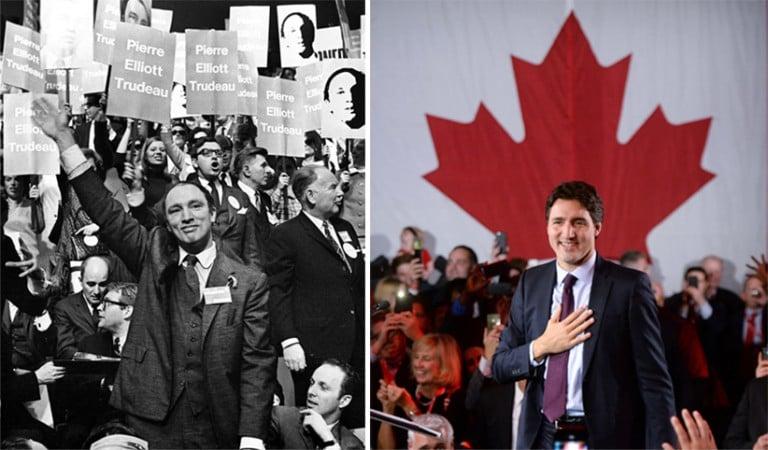
R: Pierre Trudeau waves to the crowd of supporters after winning the Liberal Leadership, April 6, 1968. (Chuck Mitchell/CP); L: Justin Trudeau is seen on stage at Liberal party headquarters in Montreal after winning the 42nd Canadian general election. (Sean Kilapatrick/CP)
Share
On the evening of Oct. 22, 1968, five months after the Liberals rode the wave of Trudeaumania to power, Pierre Trudeau’s first finance minister, Edgar Benson, rose in the House of Commons to deliver the government’s first budget. “We are in a period of widespread prosperity,” he announced in his budget speech, “but it is prosperity with problems.”
Today we have problems with prosperity. Period.
The economy Pierre inherited from his predecessor, Lester Pearson, was in far better shape than what Stephen Harper left Prime Minister Justin Trudeau. Of course, Pearson didn’t face a global recession while in office, let alone a recession in the U.S. or Canada. Instead, Canada’s economy was enjoying supercharged growth in 1968, when Pierre’s first budget was unveiled. Yet that posed its own problems, with the staggeringly high inflation of the 1970s already showing up in rising prices.
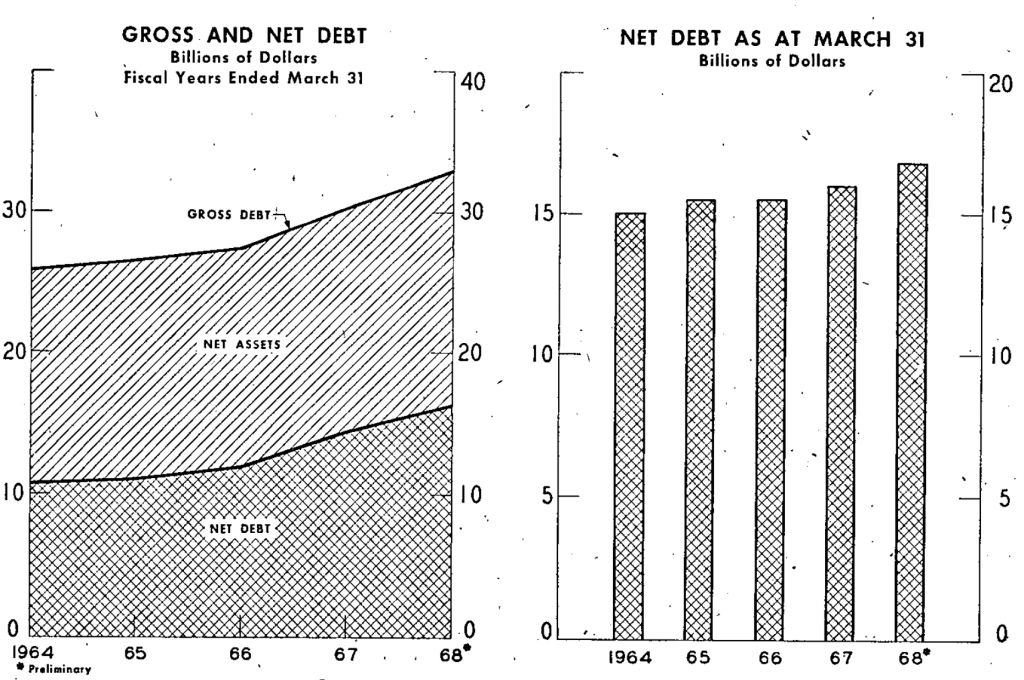
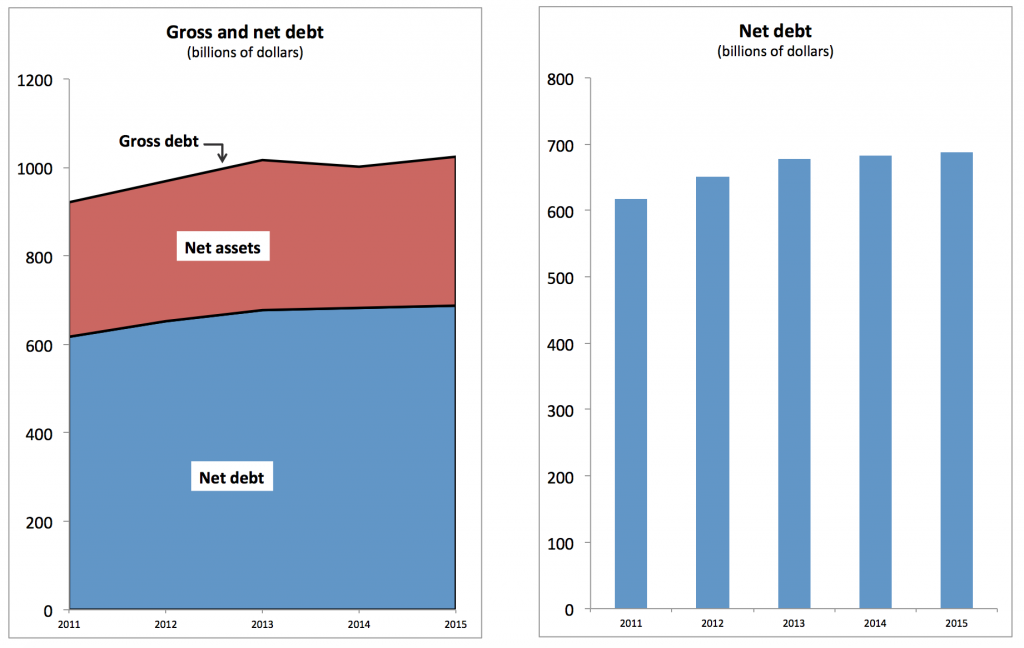
To paint a picture of the economy that each Trudeau inherited, we took 10 charts from Benson’s budget documents, then recreated them for the modern era.
Economic growth — the hot, and the not
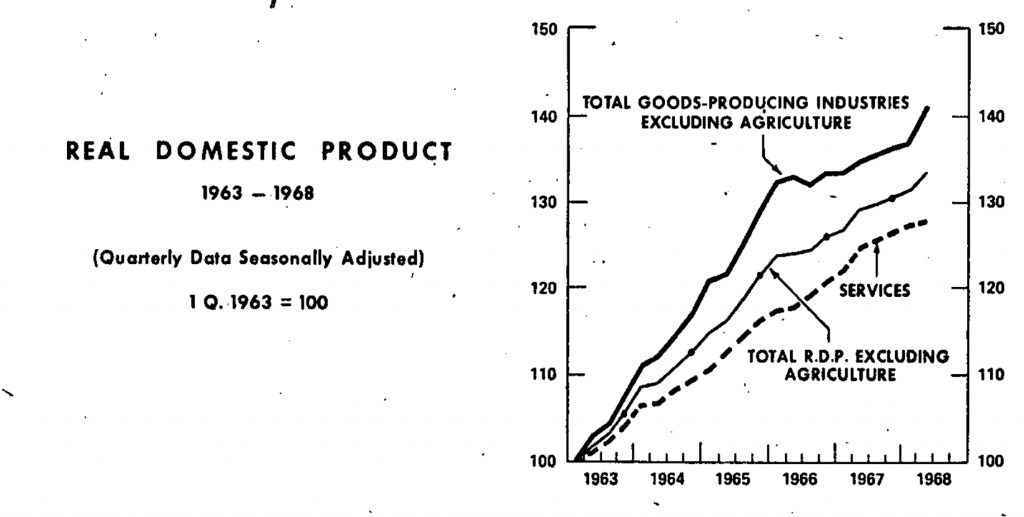
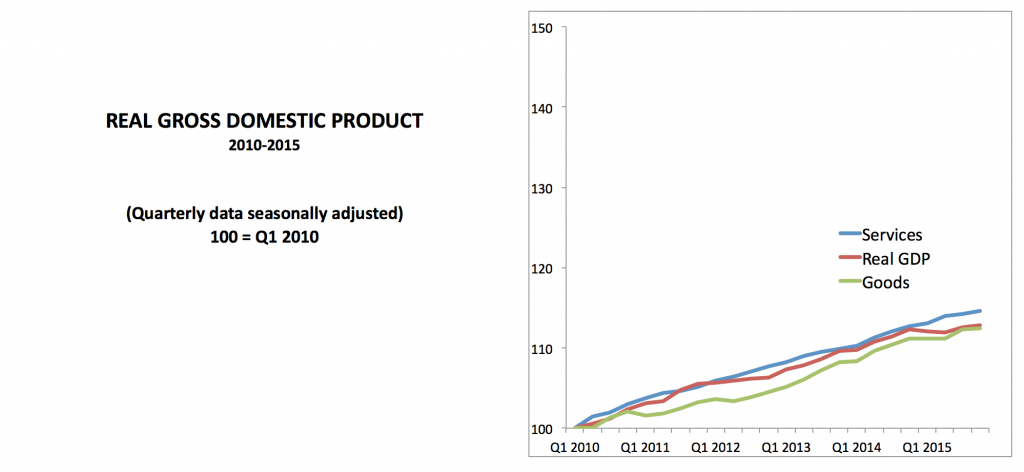
In the five years Pearson lead Canada, real GDP—a measure of economic growth that accounts for inflation—expanded by more than 30 per cent, or at an average of close to six per cent per year. The updated chart above, which uses the same scale as the one in 1968, drives home how lacklustre our growth is today. Since 2010 the economy has expanded at less than one-third that earlier pace, held down by fallout from the Great Recession, Harper’s austerity measures and the effects of the oil crash starting in 2014.
It is this sluggishness that Justin has promised to address by unleashing federal spending. But while many hold the view that more spending by Ottawa is the cure for what ails the economy, don’t expect a return to anything like the growth Canada enjoyed in the late 1960s.
Blame demographics. Consider this: in his budget speech, Benson boasted of Canada’s “continuous rapid gains in population.” Over a five-year period starting in the late 1960s, Canada’s working age population—those aged 15 to 64—grew by 13.1 per cent. By comparison, from 2011 to 2015 that same crucial slice of the population grew just 2.3 per cent. Even with the recently announced plan to boost immigration, Canada still faces a yawning demographic gap that will weigh down growth, regardless of new stimulus measures and bigger deficits.
In the hole — some things never change
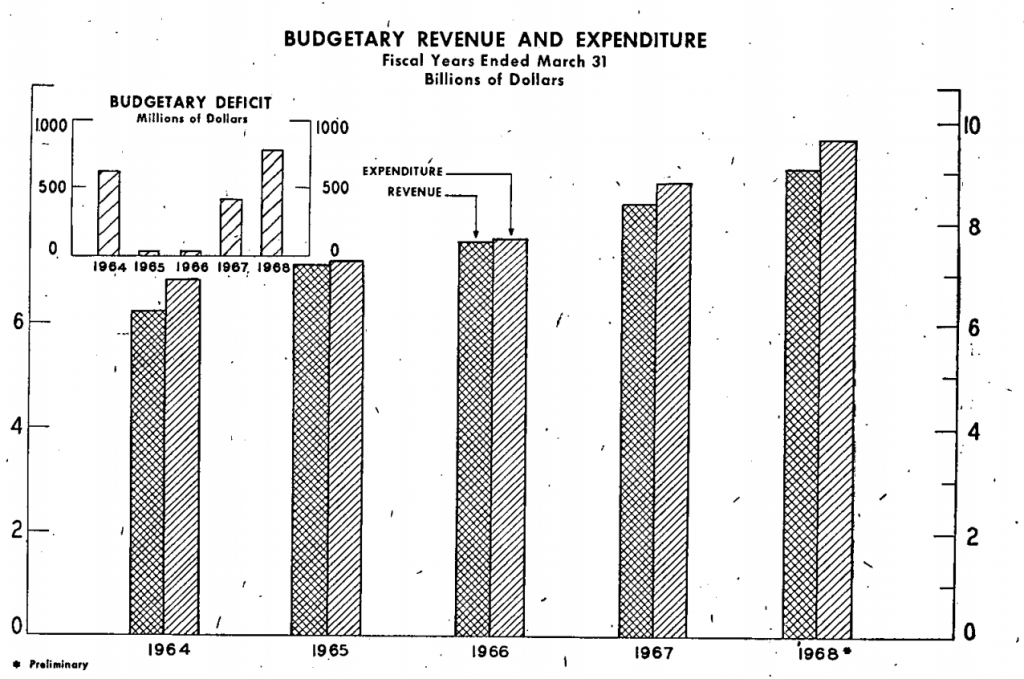
Speaking of deficits, in his budget speech in 1968 Benson predicted Canada would face a “substantial deficit” of $730 million for that year (which in today’s terms would be $5 billion). Measured against the size of Canada’s economy at the time, Pierre started off with a deficit of 0.9 per cent of GDP. By the time he vacated the prime minister’s office the first time, in 1979, that figure had soared to 5.3 per cent and when he left for good in 1984 Canada’s deficit had exploded to a crushing 7.9 per cent of GDP. (It would ultimately peak at 8.3 per cent during Brian Mulroney’s first year in office.)
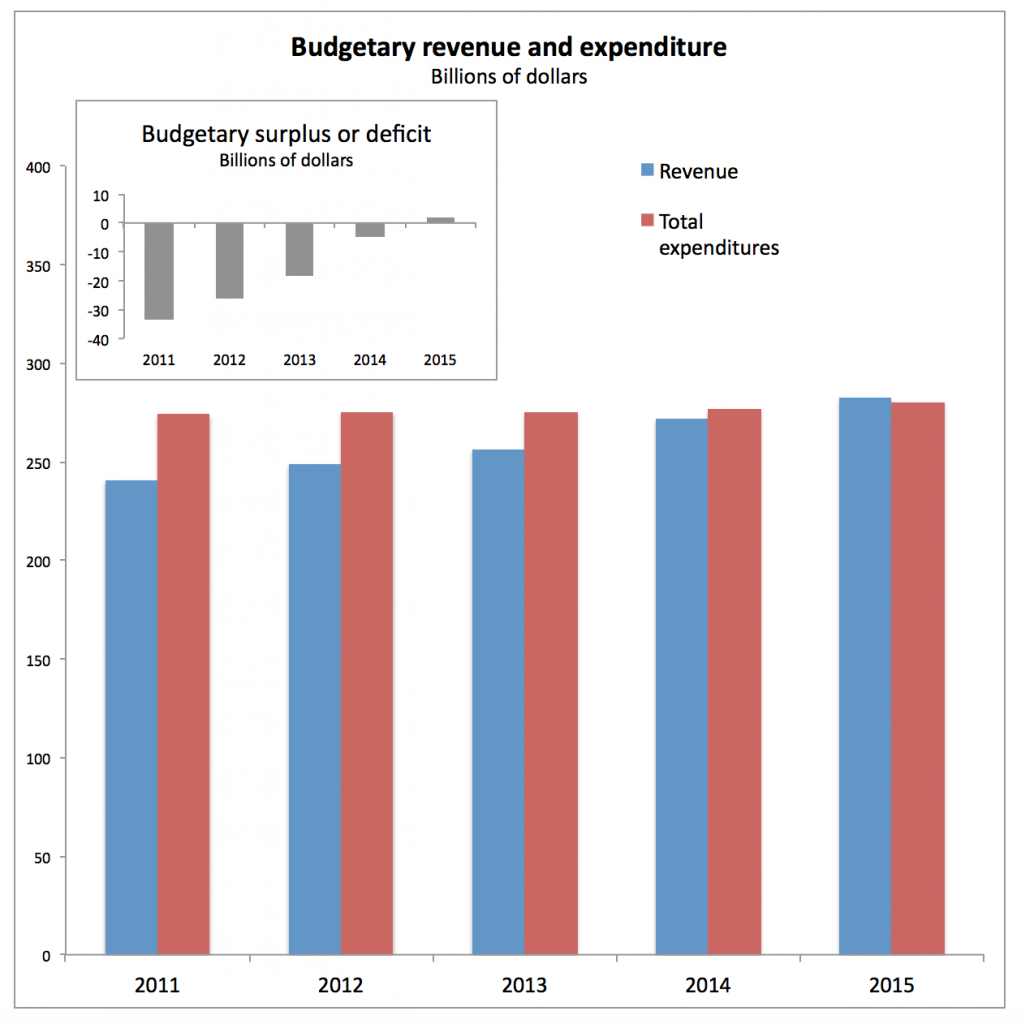
By comparison Justin inherited what effectively was a balanced budget. In Harper’s last full fiscal year, 2014-15, Ottawa posted a small surplus, while in November the Office of the Parliamentary Budget Officer said that absent any policy changes, 2015-16 would see another slight surplus, which would revert to an average deficit of 0.2 per cent of GDP over the next few years. But policies have changed, of course, and Finance Minister Bill Morneau now predicts a deficit of $2.3 billion this year and $18.4 billion in 2016-17.
That forecast doesn’t take into account new spending and tax measures that will come out of Tuesday’s budget. It’s expected Morneau will announce at least a $30-billion deficit for 2016-17—three times what Justin campaigned on during the last election—which would equate to 1.5 per cent of GDP. “Substantial,” as Benson might say.
More deficits, more debt
Both Justin and his finance minister have said that while Canada’s debt level will rise under their watch, the debt-to-GDP ratio—a measure of the country’s ability to manage its debts—will decline. That’s because the additional spending will grow the economy faster than the new debt piles up, or at least that’s the pitch.
TD Economics isn’t buying it. Based on Liberal platform commitments, the bank’s economists forecast five years of $30-billion annual deficits, adding $150 billion to the nation’s debt by 2020-21, and pushing Canada’s debt-to-GDP ratio from 31 per cent to 36.1 per cent.
To put that in perspective, Canada’s debt-to-GDP ratio was around 22 per cent at the time of Pierre’s first budget.
Where the money came from, and went
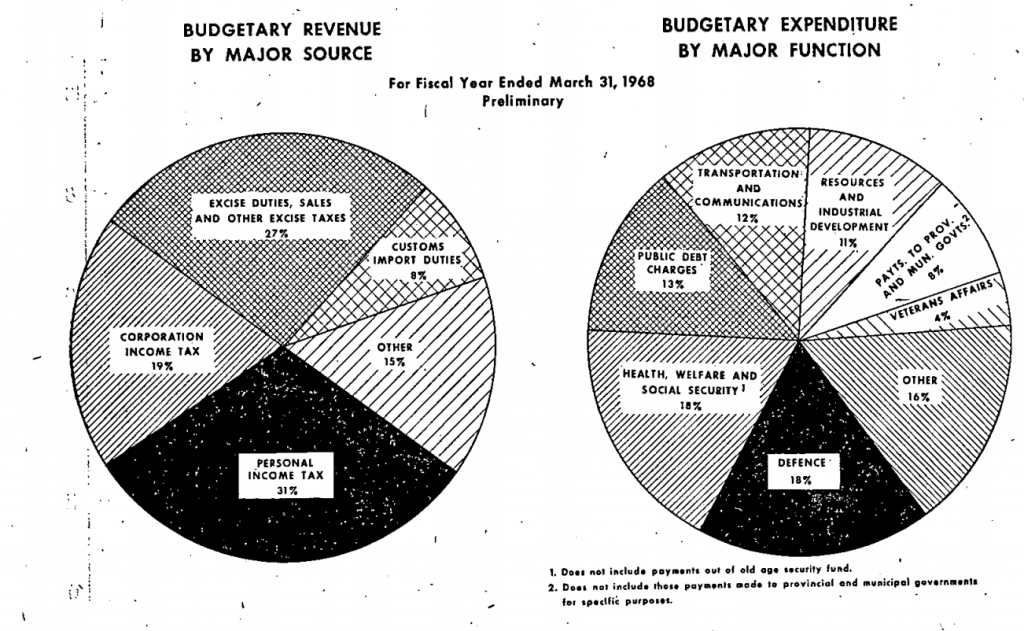
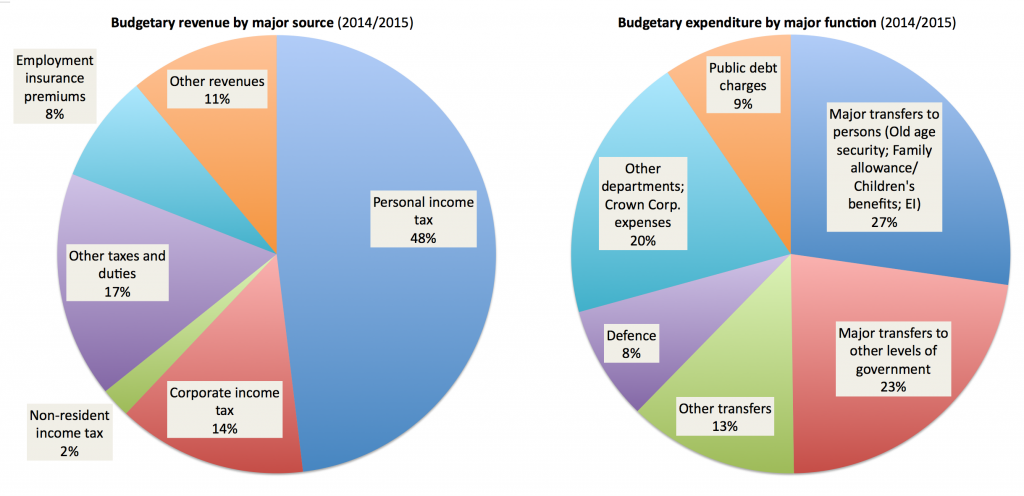
Due to changes over time in the way government departments are structured and how government accounting standards have changed, it’s impossible to exactly reproduce the chart from 1968 on revenues and expenditures. However, the updated version, drawn from the Department of Finance’s fiscal reference tables, does reveal several interesting shifts. For instance:
-Personal income tax has come to play a much larger role in financing government—growing from 31 per cent of revenue to 48 per cent—while corporate income taxes have become less important.
-Defence spending as a share of total expenditures has shrunk considerably since Pierre’s first budget, from 18 per cent to just eight per cent. Canada’s armed forces were much larger back then, with a regular force of more than 100,000 troops (compared to around 68,000 today) and still boasted an aircraft carrier—an aircraft carrier!—though Pierre would go on to impose deep cuts to Canada’s military spending.
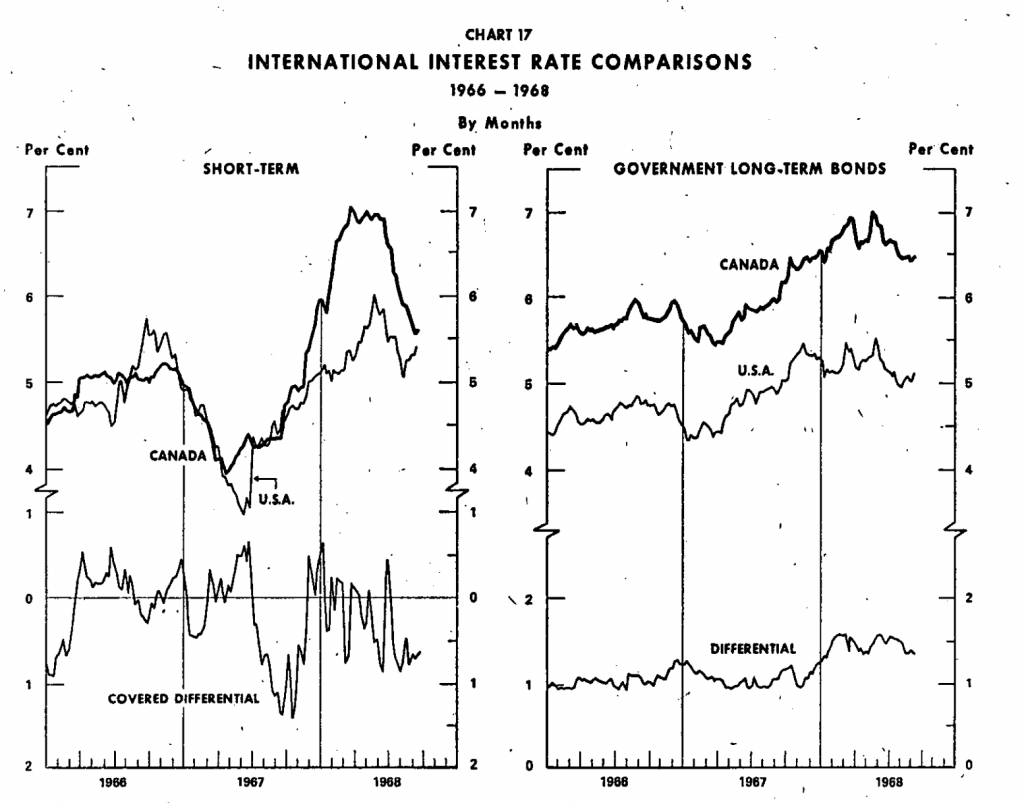
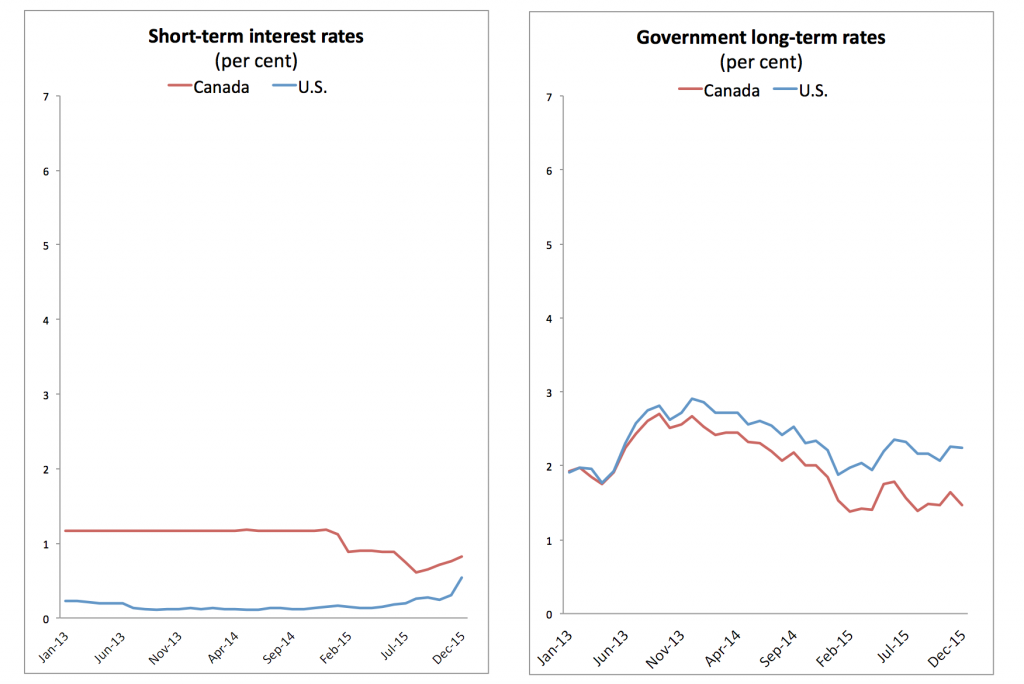
-Public debt charges, the interest the Government of Canada pays on the money it’s borrowed, has shrunk as a share of total expenditures. That’s of course due to incredibly low interest rates, which does give Justin more breathing room to borrow and spend—so long as interests rates don’t rise again.
Interest rate highs and lows
Interest rates certainly can’t go much lower without the Bank of Canada dipping into negative territory, which is a distinct possibility during Justin’s first term.
Working hard, hardly working
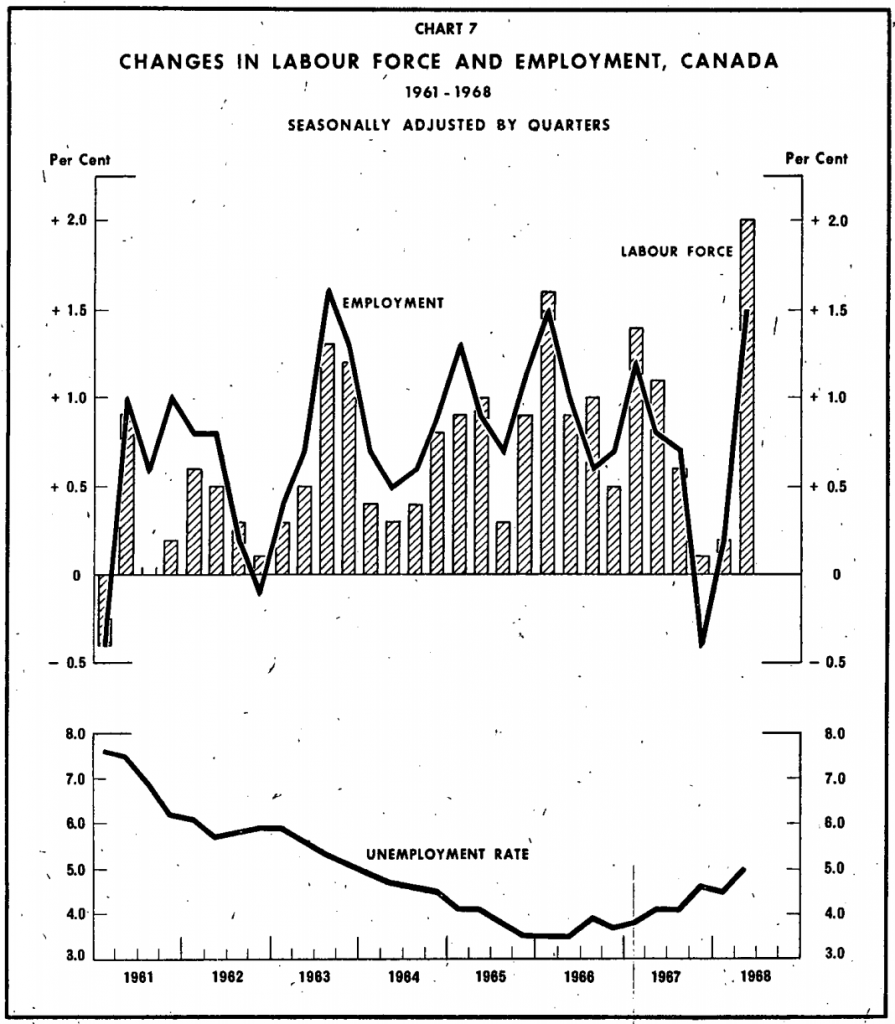
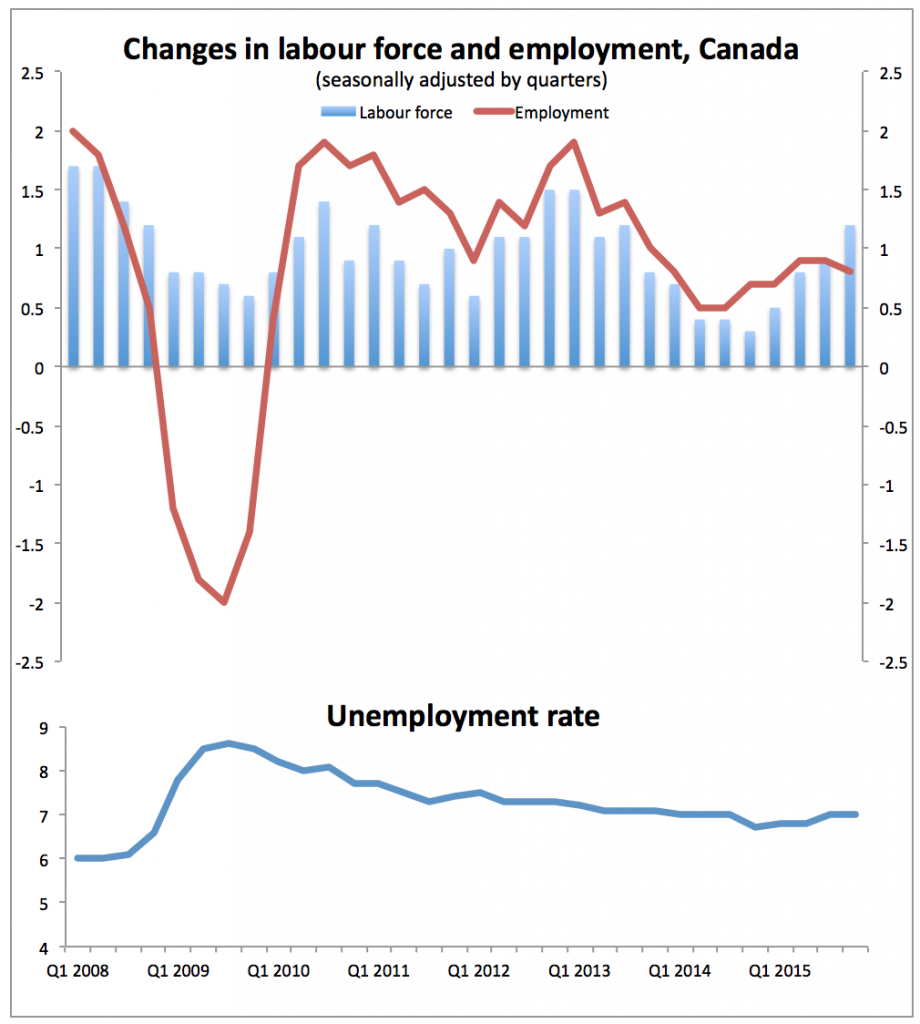
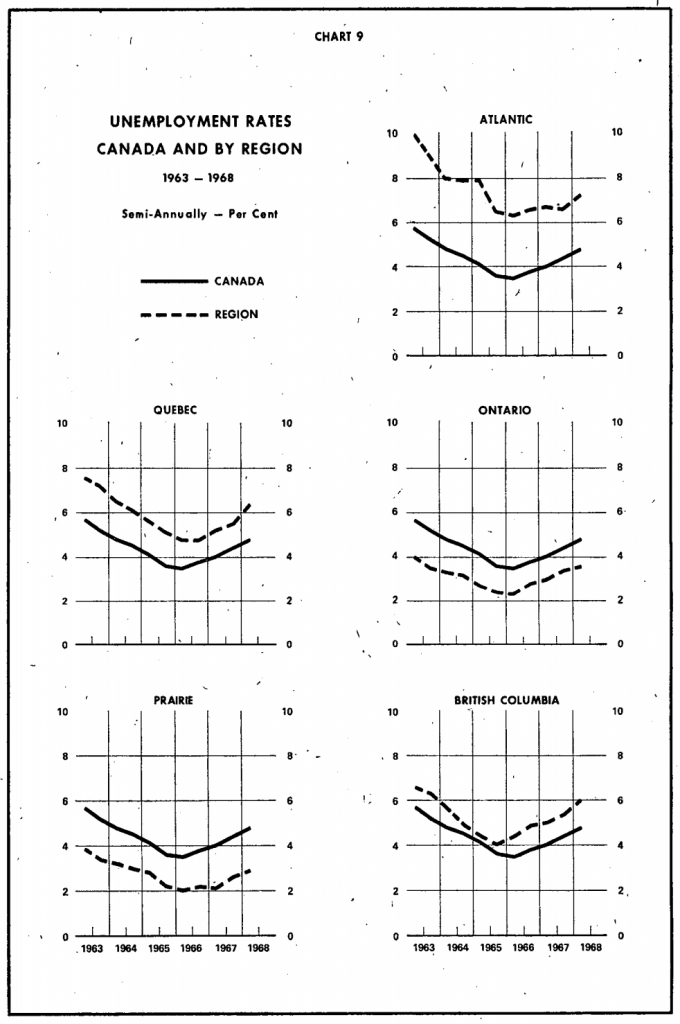
Let’s just pause for a moment and look yearningly at that unemployment rate in the mid-to-late 1960s. No, your eyes aren’t deceiving you. It was around 3.5 per cent. It’s never come close to that level since, and may well never again.
Meanwhile over the last year Canada’s unemployment rate has been creeping back up.
Where the jobs were, weren’t, are and aren’t
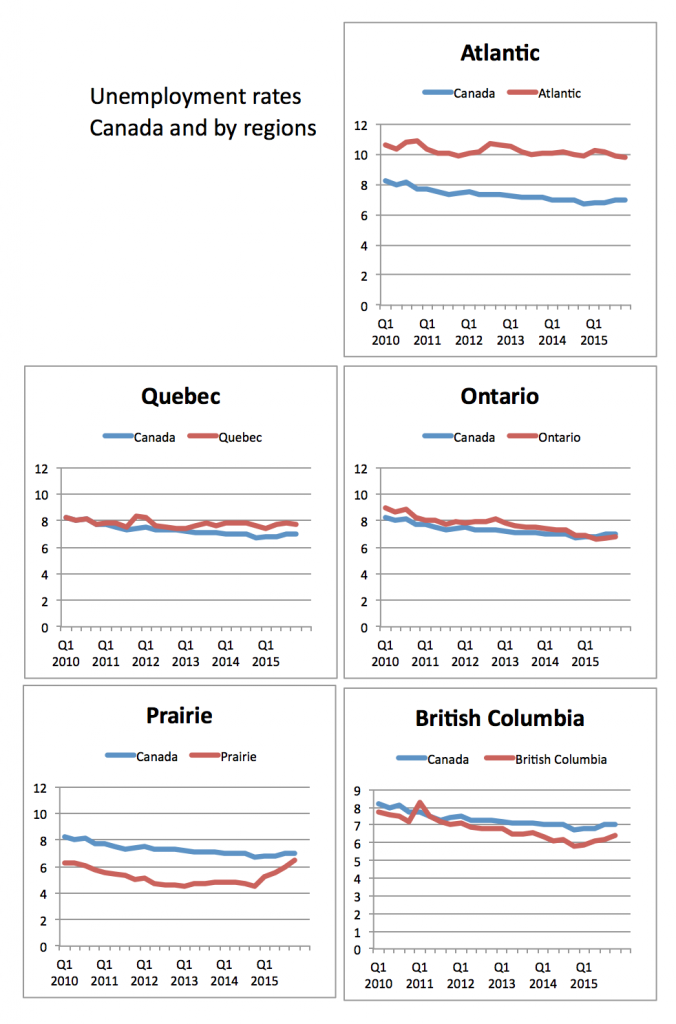
Here’s another look at employment, this by region. While the unemployment rate in Atlantic Canada remains chronically high, the long-standing Prairie advantage has been erased over the last year by layoffs related to the commodity crash.
Job growth at home and abroad
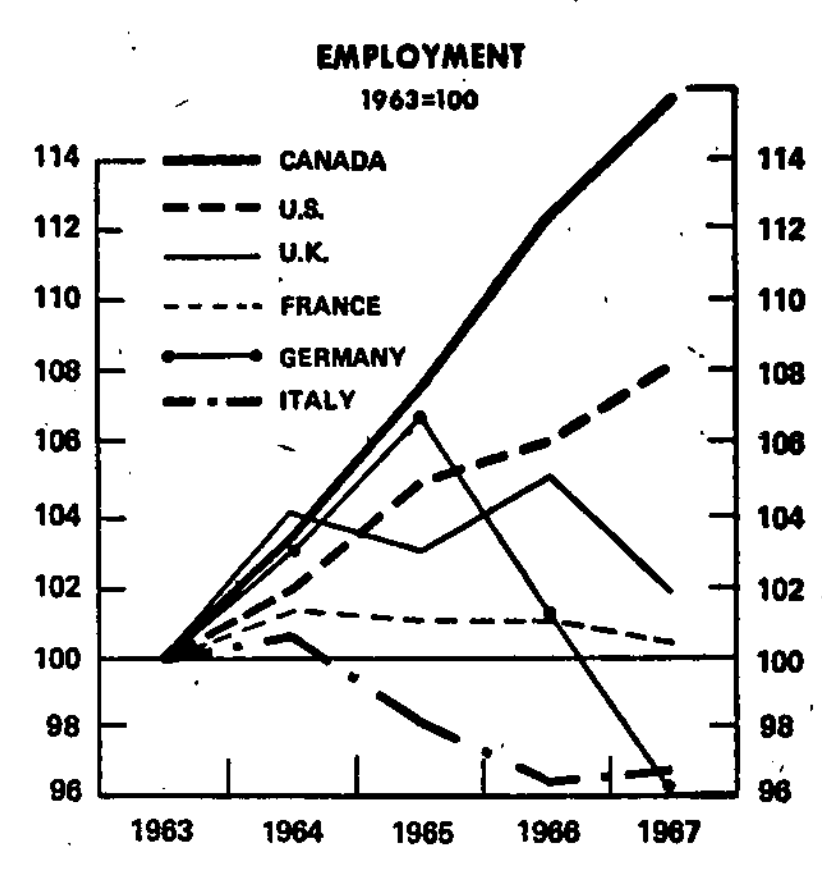
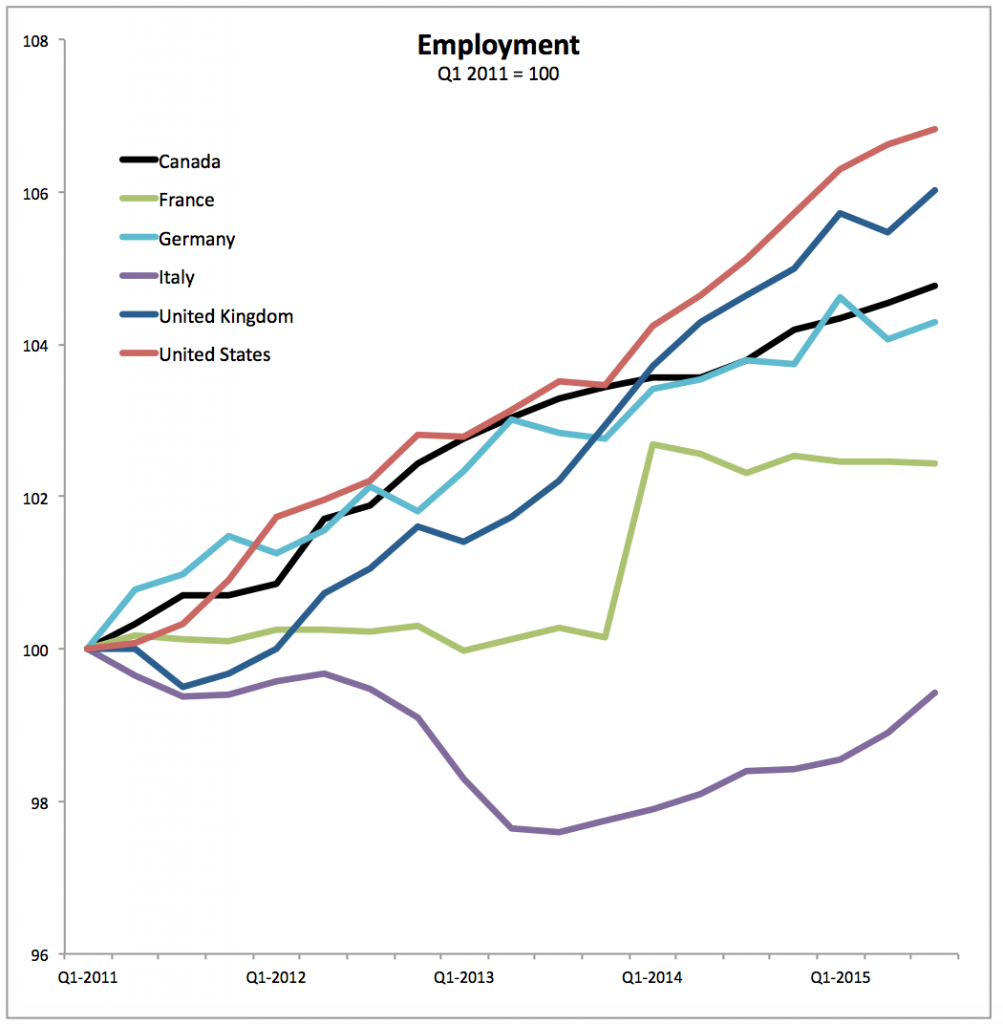
One last jobs chart, this comparing Canada to the world. Harper used to regularly boast that Canada had the best record on job performance of any country in the G7 since the end of the recession, and that was true. However, since 2014, when the commodity bubble burst and sent oil prices crashing back to earth, Canada’s pace of employment growth has fallen behind that of the United States and the United Kingdom.
What’s more, the scale of the job gains is more muted now across the board, which is again a function of demographics. Whereas employment in Canada grew by more than 14 per cent in the five year’s prior to the 1968 budget, even the top performer this time around, the United States, has managed just half that.
As for the rest of the countries shown, what can we say—at least Italy is consistent.
From inflation fears to disinflation fears
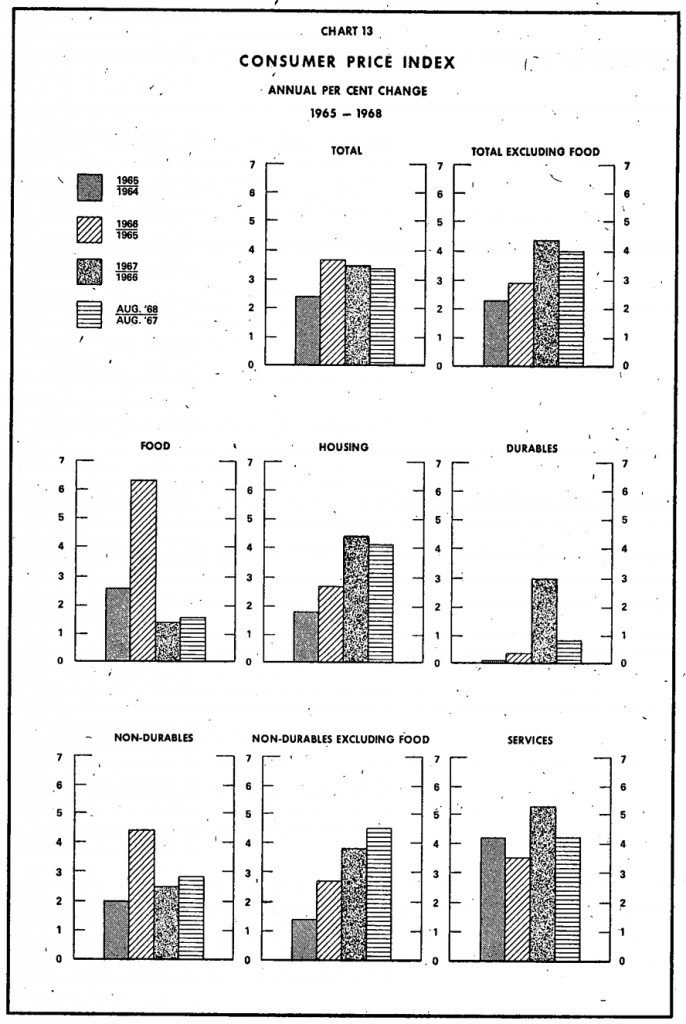
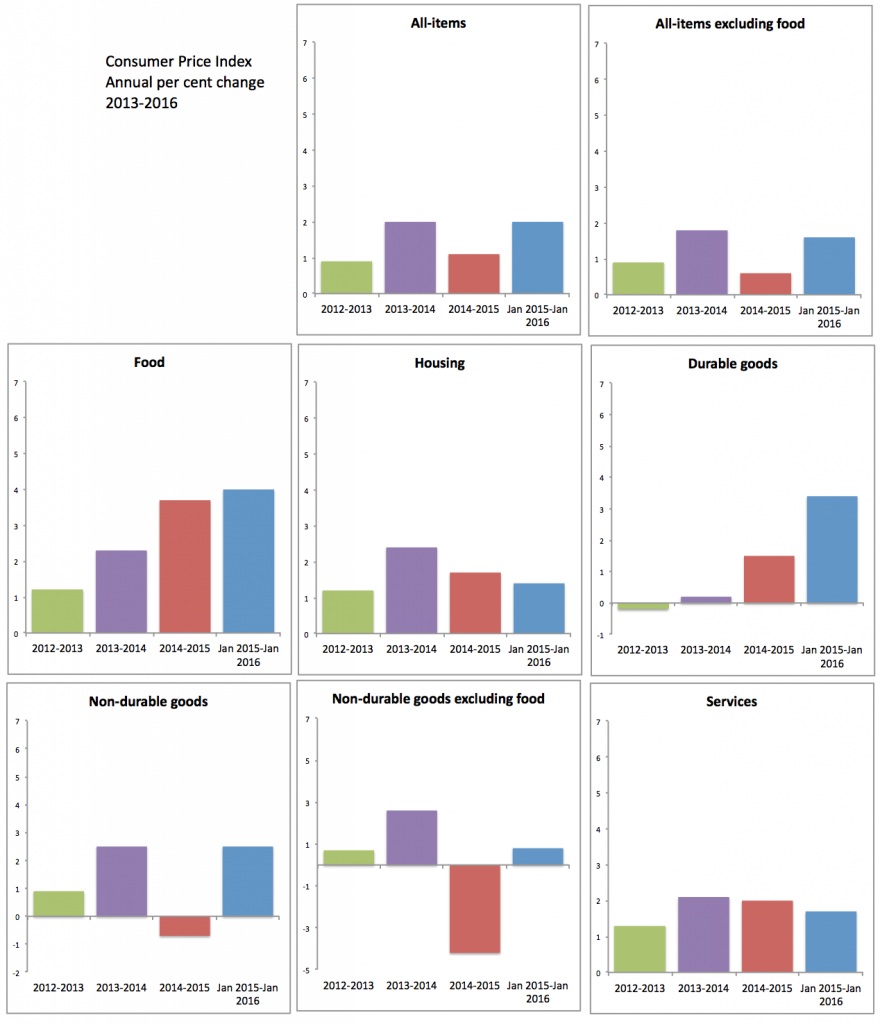
In his budget speech Benson made clear what he saw as his top challenge: “In the broad field of economic policy, the most urgent need now is to check further the continuing increase in prices and living costs.” At the time the Consumer Price Index had been rising at more than 3.5 per cent each year, a precursor of the higher rates to come in the 1970s.
While the Canadian Cauliflower Panic of 2016 reflected modern anger over rising food prices—which are a direct result of the lower loonie driving up import costs—inflation today is far more subdued. Too subdued. Over the last five years inflation has regularly fallen below the Bank of Canada’s target of two per cent, despite record low interest rates, leading to concerns at the bank about disinflation. The question for the economy now is whether the current Trudeau government’s more stimulative fiscal policy can do what monetary policy has so far failed to achieve.
* Note to those wondering how national house prices could be rising at 15 per cent a year, yet housing inflation (the term now used by Statistics Canada is shelter) is so subdued in the chart: that’s because house price appreciation isn’t factored in. Instead, it measures changes in the cost of housing services, like rent, mortgage interest payments, mortgage insurance, property taxes and utilities.
A dollar’s worth
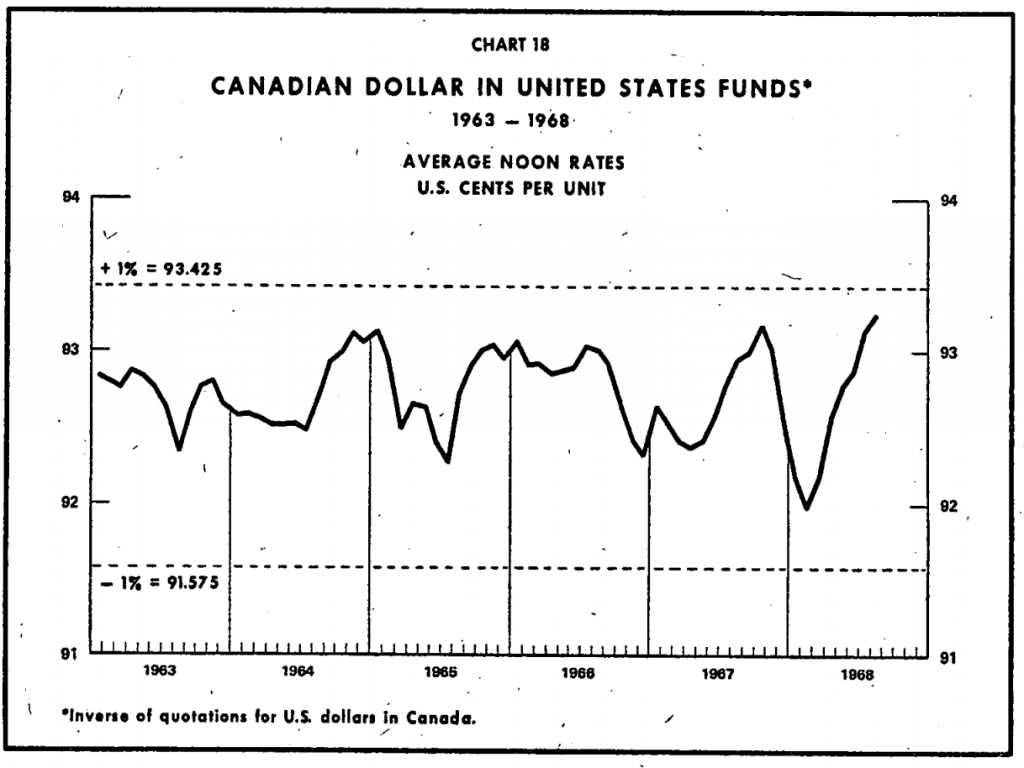
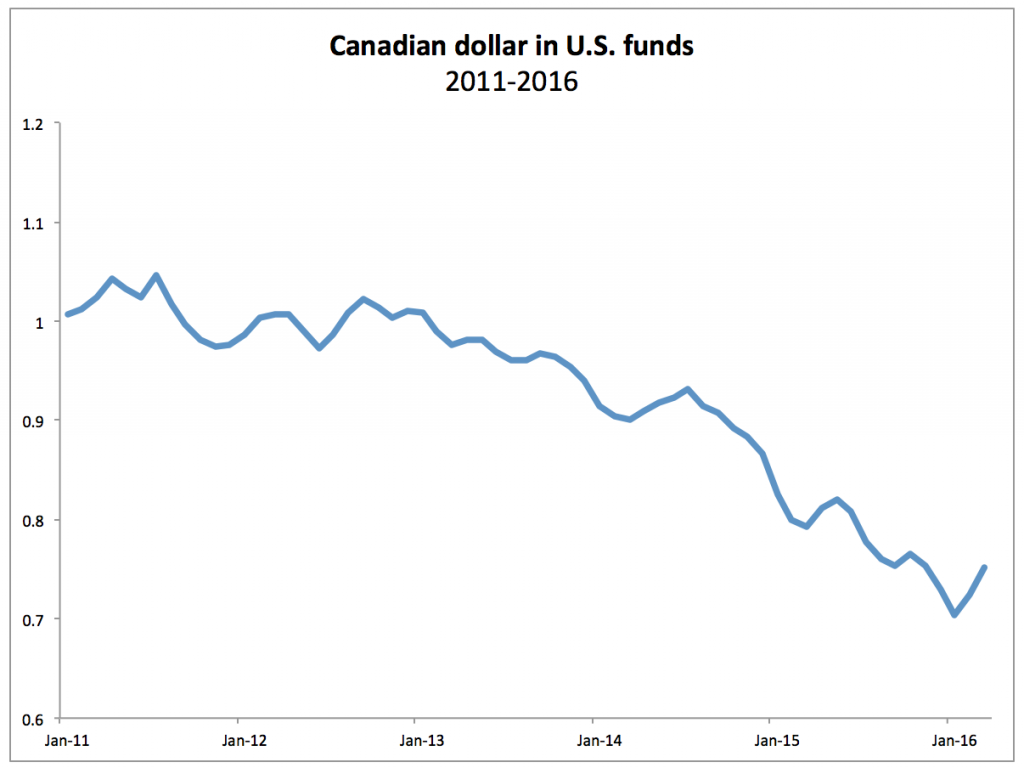
About that cauliflower crisis, this was a major culprit. The Canadian dollar has shed more than 30 per cent of its value against the Greenback since 2011. But while higher prices for imported goods are hitting consumers, manufacturers and exporters have benefited. However, the volatility of Canada’s currency remains a problem—since January the loonie has soared 13 per cent.
That wasn’t a problem in the lead-up to Pierre’s first budget, when the dollar bounced between 92 and 93 cents U.S. Stability like that would go a long way to helping Canadian businesses today.
