Canada’s top 25 best places to live in 2018
The No. 1 spot has a strong economy, low crime rates and great weather according to a new study

(City of Whitby)
Share
This article first appeared on MoneySense.ca. Learn more.
—Updated 08/08/2018 to reflect correct figures for ‘property tax as percentage of income’—

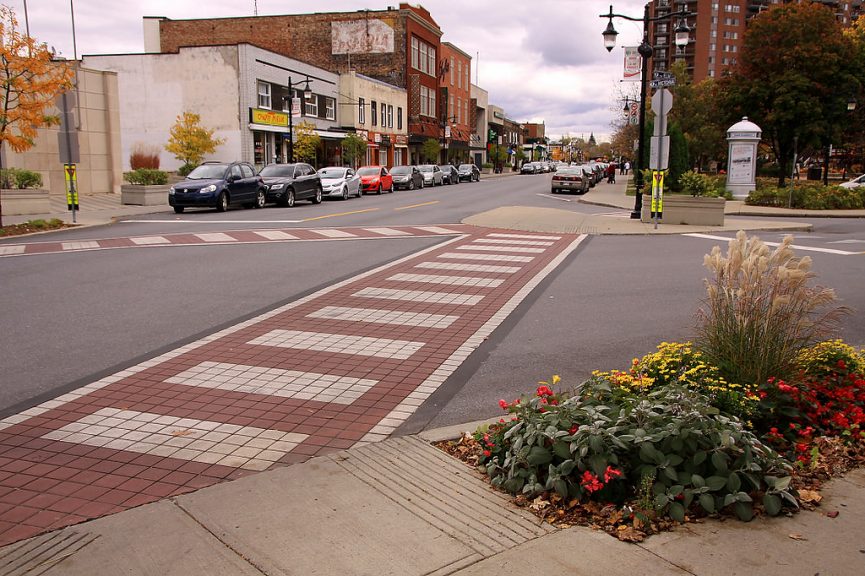
25. Whitby, Ont.
Rank in 2017: 103
Population: 136,657
Estimated Unemployment Rate: 5.7%
Median Household Income: $101,792
Average Household Net Worth: $817,453
Property Tax as % of Income: 2.7%
Total Days Above 20°C: 100
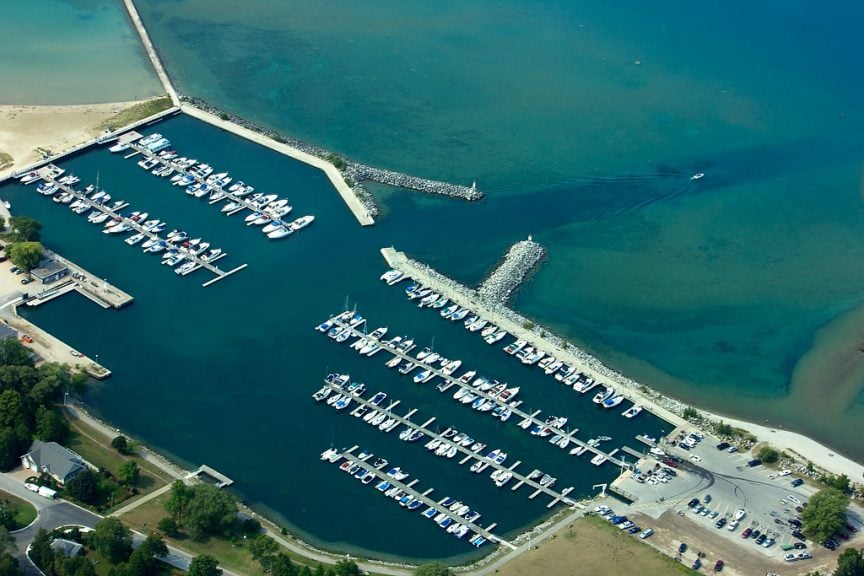
Crime Rate Per 100,000:* 3,251
Family Doctors Per 100,000:* 81
See more stats about Whitby, Ont. here.
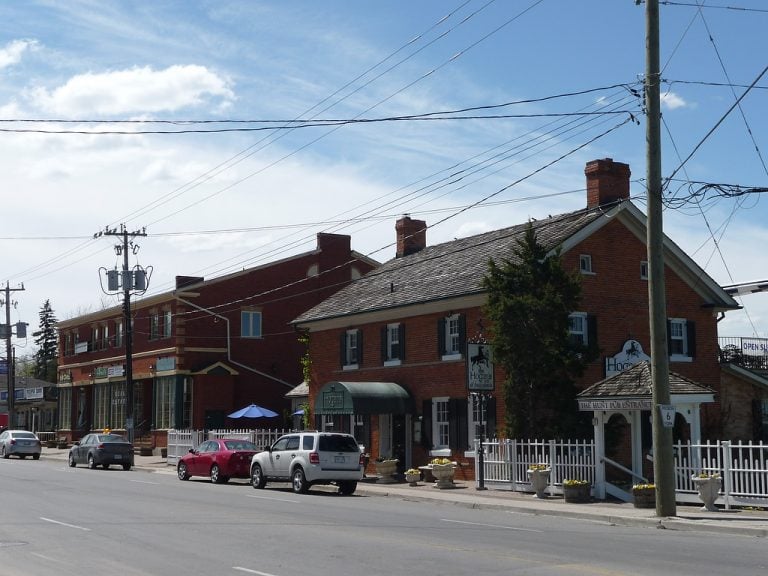
24. New Tecumseth, Ont.
Rank in 2017: 170
Population: 36,745
Estimated Unemployment Rate: 5.7%
Median Household Income: $96,041
Average Household Net Worth: $755,965
Property Tax as % of Income: 2.6%
Total Days Above 20°C: 122
Crime Rate Per 100,000:* 2,906
Family Doctors Per 100,000:* 95
See more stats about New Tecumseth, Ont. here.
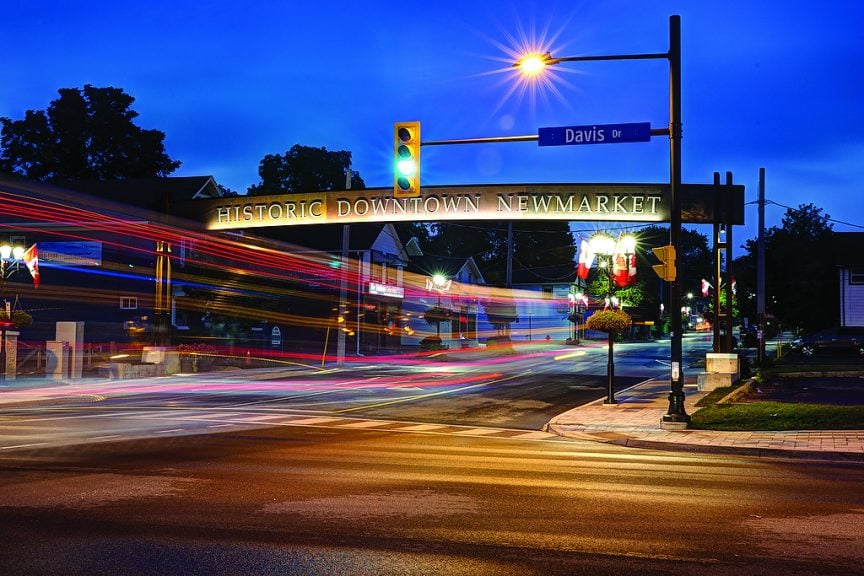
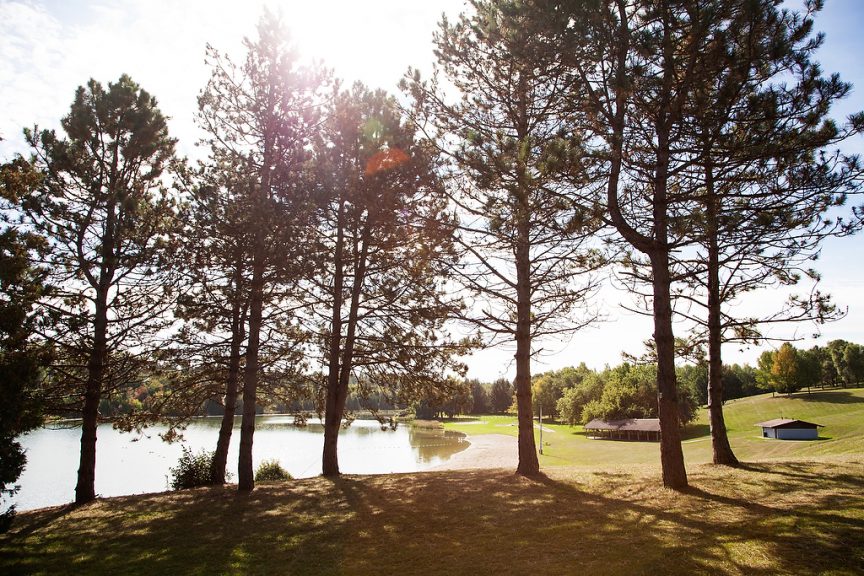
23. Newmarket, Ont.
Rank in 2017: 56
Population: 90,908
Estimated Unemployment Rate: 5.7%
Median Household Income: $95,636
Average Household Net Worth: $947,429
Property Tax as % of Income: 2.7%
Total Days Above 20°C: 107
Crime Rate Per 100,000:* 2,749
Family Doctors Per 100,000:* 95
See more stats about Newmarket, Ont. here.
22. Bonnyville No. 87, Alta.
Rank in 2017: 228
Population: 14,658
Estimated Unemployment Rate: 3.9%
Median Household Income: $103,652
Average Household Net Worth: $789,157
Property Tax as % of Income: 1.4%
Total Days Above 20°C: 86
Crime Rate Per 100,000:* 4,899
Family Doctors Per 100,000:* 93
See more stats about Bonnyville No. 87, Alta. here.
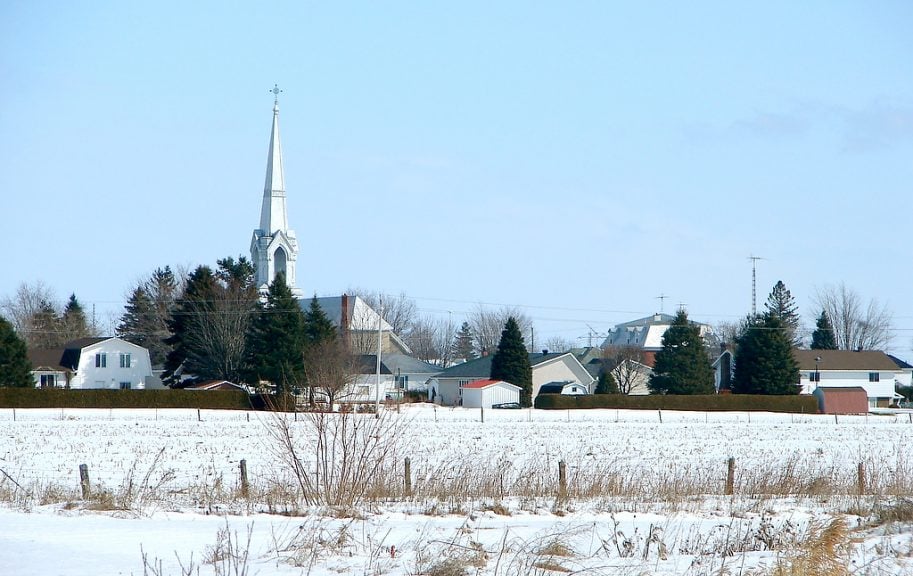
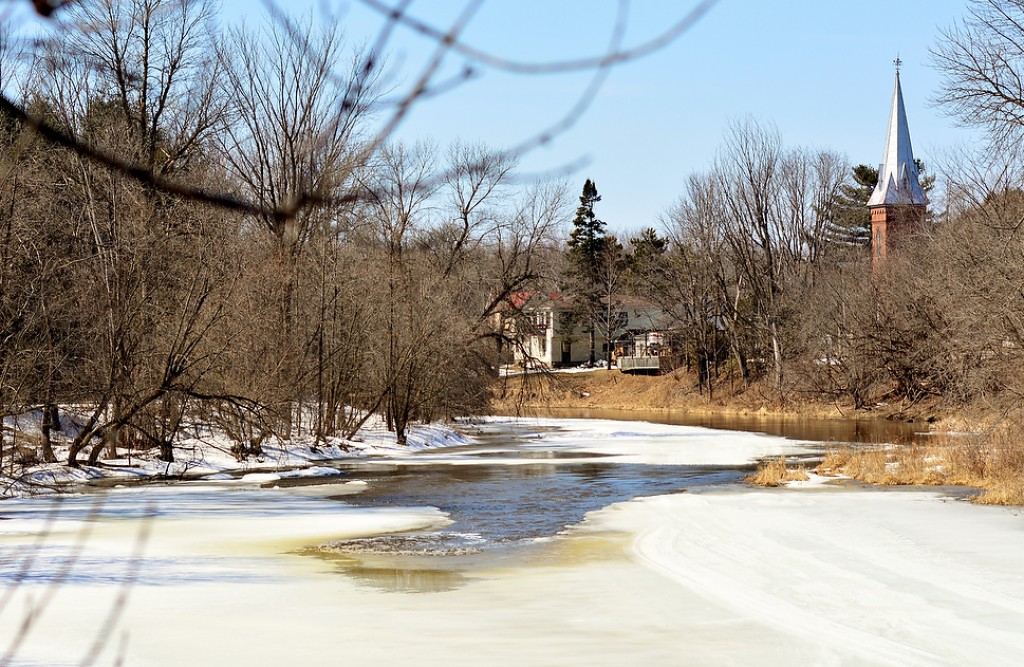
21. The Nation, Ont.
Rank in 2017: 123
Population: 13,275
Estimated Unemployment Rate: 5.1%
Median Household Income: $88,088
Average Household Net Worth: $478,620
Property Tax as % of Income: 2.2%
Total Days Above 20°C: 113
Crime Rate Per 100,000:* 2,186
Family Doctors Per 100,000:* 142
See more stats about The Nation, Ont. here.

20. Whistler, B.C.
Rank in 2017: 84
Population: 13,193
Estimated Unemployment Rate: 4.3%
Median Household Income: $86,423
Average Household Net Worth: $1,460,422
Property Tax as % of Income: 1.2%
Total Days Above 20°C: 83
Crime Rate Per 100,000:* 14,137
Family Doctors Per 100,000:* 159
See more stats about Whistler, B.C. here.
19. St. Albert, Alta.
Rank in 2017: 7
Population: 70,874
Estimated Unemployment Rate: 6.8%
Median Household Income: $123,948
Average Household Net Worth: $900,192
Property Tax as % of Income: 2.0%
Total Days Above 20°C: 84
Crime Rate Per 100,000:* 5,313
Family Doctors Per 100,000:* 129
See more stats about St. Albert, Alta. here.
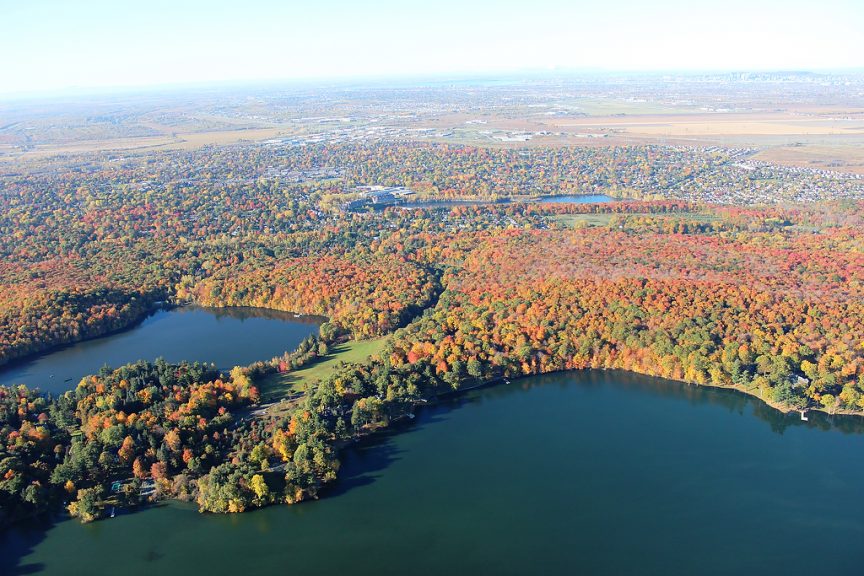
18. King, Ont.
Rank in 2017: 68
Population: 26,697
Estimated Unemployment Rate: 5.7%
Median Household Income: $110,816
Average Household Net Worth: $2,655,435
Property Tax as % of Income: 2.6%
Total Days Above 20°C: 114
Crime Rate Per 100,000:* 2,749
Family Doctors Per 100,000:* 95
See more stats about King, Ont. here.
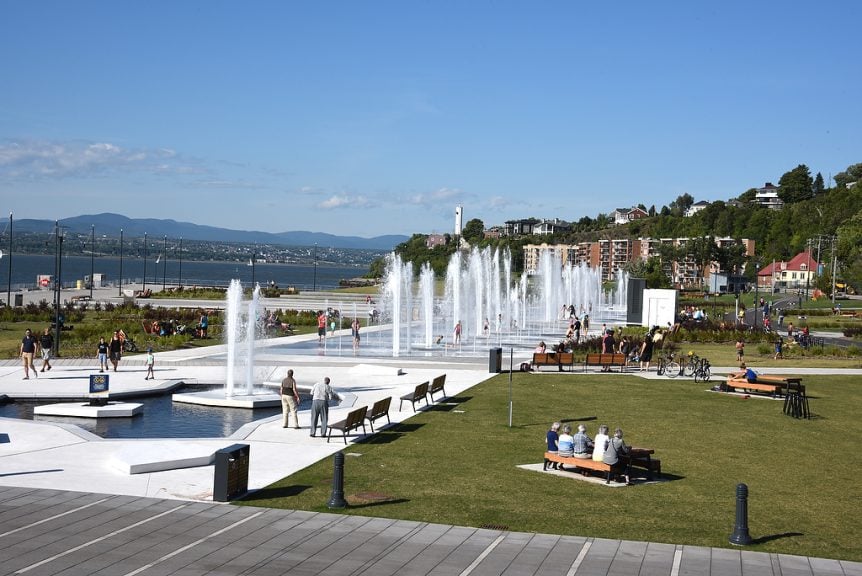
17. Lévis, Que.
Rank in 2017: 9
Population: 147,403
Estimated Unemployment Rate: 3.4%
Median Household Income: $79,323
Average Household Net Worth: $387,146
Property Tax as % of Income: 2.0%
Total Days Above 20°C: 94
Crime Rate Per 100,000:* 2,784
Family Doctors Per 100,000:* 106
See more stats about Lévis, Que. here.

16. Toronto, Ont.
Rank in 2017: 129
Population: 2,933,262
Estimated Unemployment Rate: 5.7%
Median Household Income: $55,945
Average Household Net Worth: $906,663
Property Tax as % of Income: 2.0%
Total Days Above 20°C: 117
Crime Rate Per 100,000:* 3,847
Family Doctors Per 100,000:* 75
See more stats about Toronto, Ont. here.
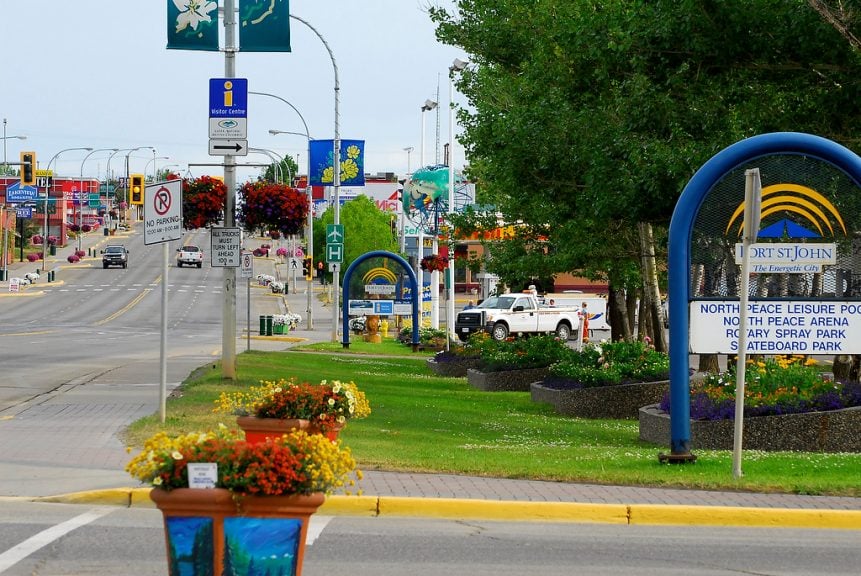
15. Fort St. John, B.C.
Rank in 2017: 160
Population: 21,251
Estimated Unemployment Rate: 5.7%
Median Household Income: $106,327
Average Household Net Worth: $440,481
Property Tax as % of Income: 1.1%
Total Days Above 20°C: 64
Crime Rate Per 100,000:* 14,000
Family Doctors Per 100,000:* 104
See more stats about Fort St. John, B.C. here.
14. Saugeen Shores, Ont.
Rank in 2017: 17
Population: 14,109
Estimated Unemployment Rate: 4.9%
Median Household Income: $105,210
Average Household Net Worth: $777,845
Property Tax as % of Income: 2.7%
Total Days Above 20°C: 110
Crime Rate Per 100,000:* 5,113
Family Doctors Per 100,000:* 107
See more stats about Saugeen Shores, Ont. here.
13. Mont-Royal, Que.
Rank in 2017: 8
Population: 21,172
Estimated Unemployment Rate: 6.3%
Median Household Income: $145,853
Average Household Net Worth: $2,392,238
Property Tax as % of Income: 3.3%
Total Days Above 20°C: 117
Crime Rate Per 100,000:* 4,594
Family Doctors Per 100,000:* 124
See more stats about Mont-Royal, Que. here.
12. Red Deer, Alta.
Rank in 2017: 330
Population: 107,564
Estimated Unemployment Rate: 4.9%
Median Household Income: $90,844
Average Household Net Worth: $628,900
Property Tax as % of Income: 1.6%
Total Days Above 20°C: 83
Crime Rate Per 100,000:* 19,460
Family Doctors Per 100,000:* 99
See more stats about Red Deer, Alta. here.

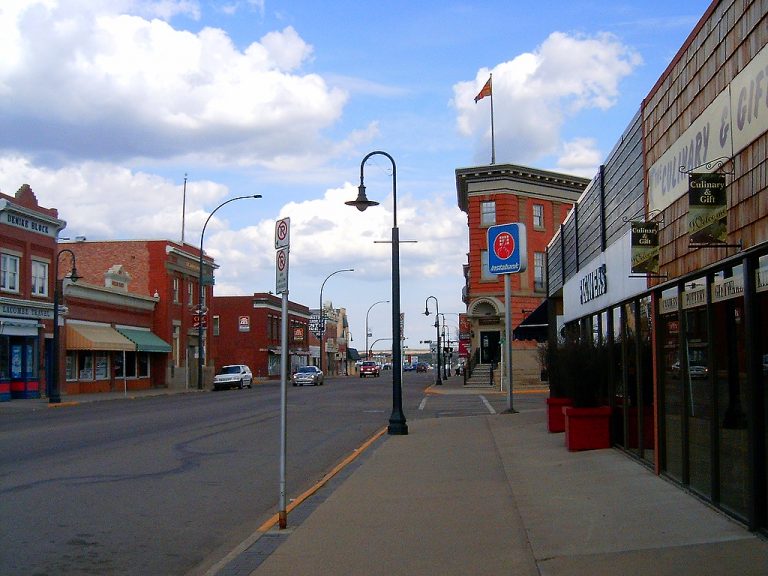
11. Camrose, Alta.
Rank in 2017: 216
Population: 19,488
Estimated Unemployment Rate: 3.9%
Median Household Income: $61,873
Average Household Net Worth: $519,846
Property Tax as % of Income: 1.8%
Total Days Above 20°C: 83
Crime Rate Per 100,000:* 9,520
Family Doctors Per 100,000:* 99
See more stats about Camrose, Alta. here.
10. Halton Hills, Ont.
Rank in 2017: 24
Population: 65,782
Estimated Unemployment Rate: 5.7%
Median Household Income: $108,410
Average Household Net Worth: $1,190,923
Property Tax as % of Income: 2.6%
Total Days Above 20°C: 120
Crime Rate Per 100,000:* 2,133
Family Doctors Per 100,000:* 91
See more stats about Halton Hills, Ont. here.
9. Saint-Lambert, Que.
Rank in 2017: 55
Population: 22,432
Estimated Unemployment Rate: 4.9%
Median Household Income: $83,626
Average Household Net Worth: $881,272
Property Tax as % of Income: 2.7%
Total Days Above 20°C: 118
Crime Rate Per 100,000:* 3,724
Family Doctors Per 100,000:* 96
See more stats about Saint-Lambert, Que. here.

8. Westmount, Que.
Rank in 2017: 52
Population: 21,083
Estimated Unemployment Rate: 7.5%
Median Household Income: $117,755
Average Household Net Worth: $3,953,205
Property Tax as % of Income: 2.7%
Total Days Above 20°C: 117
Crime Rate Per 100,000:* 4,594
Family Doctors Per 100,000:* 124
See more stats about Westmount, Que. here.
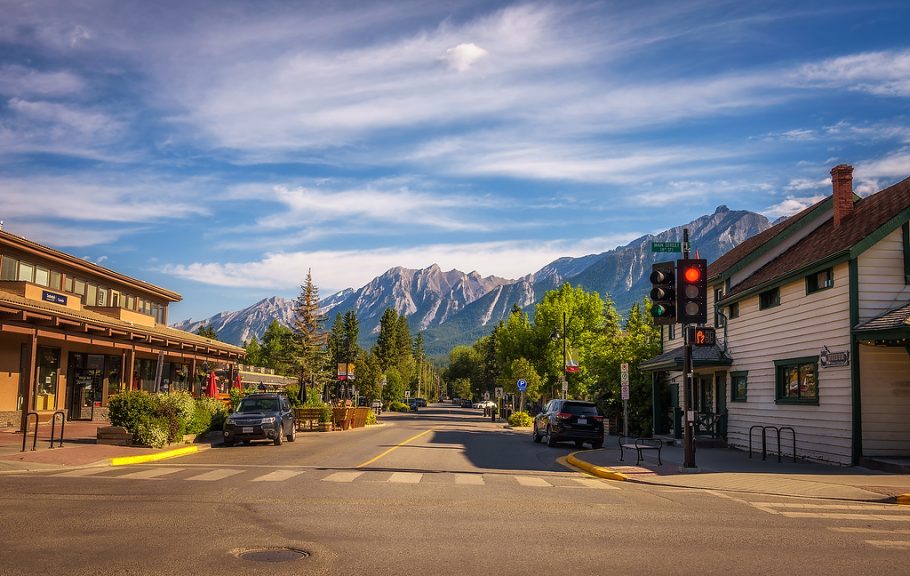
7. Canmore, Alta.
Rank in 2017: 29
Population: 14,930
Estimated Unemployment Rate: 5.1%
Median Household Income: $75,848
Average Household Net Worth: $1,478,315
Property Tax as % of Income: 1.2%
Total Days Above 20°C: 64
Crime Rate Per 100,000:* 7,482
Family Doctors Per 100,000:* 138
See more stats about Canmore, Alta. here.
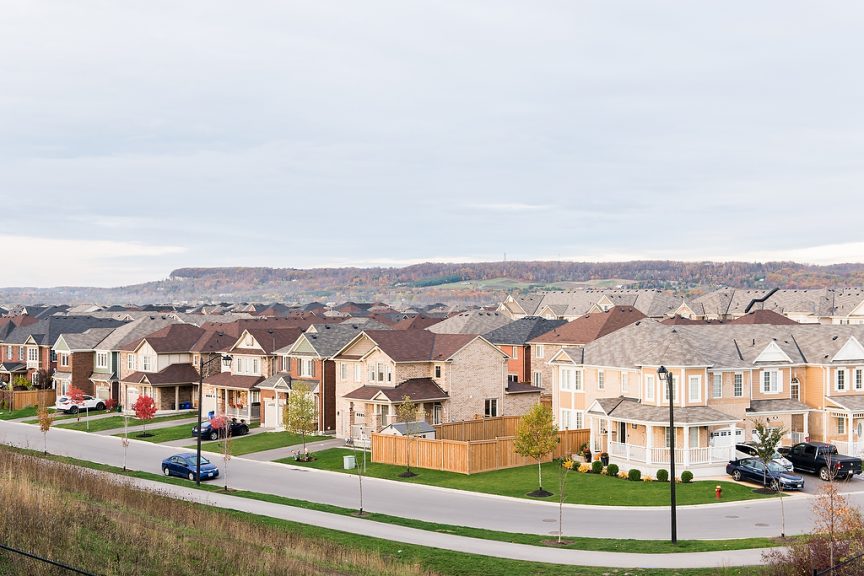
6. Milton, Ont.
Rank in 2017: 151
Population: 120,556
Estimated Unemployment Rate: 5.7%
Median Household Income: $111,875
Average Household Net Worth: $1,129,276
Property Tax as % of Income: 2.0%
Total Days Above 20°C: 120
Crime Rate Per 100,000:* 2,133
Family Doctors Per 100,000:* 91
See more stats about Milton, Ont. here.
5. Lacombe, Alta.
Rank in 2017: 299
Population: 13,906
Estimated Unemployment Rate: 4.9%
Median Household Income: $97,800
Average Household Net Worth: $754,291
Property Tax as % of Income: 1.8%
Total Days Above 20°C: 81
Crime Rate Per 100,000:* 7,932
Family Doctors Per 100,000:* 99
See more stats about Lacombe, Alta. here.
4. Saint-Bruno-de-Montarville, Que.
Rank in 2017: 6
Population: 27,171
Estimated Unemployment Rate: 4.9%
Median Household Income: $96,757
Average Household Net Worth: $864,221
Property Tax as % of Income: 2.6%
Total Days Above 20°C: 118
Crime Rate Per 100,000:* 3,724
Family Doctors Per 100,000:* 96
See more stats about Saint-Bruno-de-Montarville, Que. here.
3. Russell Township, Ont.
Rank in 2017: 21
Population: 17,155
Estimated Unemployment Rate: 5.1%
Median Household Income: $112,644
Average Household Net Worth: $509,564
Property Tax as % of Income: 2.2%
Total Days Above 20°C: 78
Crime Rate Per 100,000:* 2,540
Family Doctors Per 100,000:* 142
See more stats about Russell Township, Ont. here.

2. Ottawa, Ont.
Rank in 2017: 1
Population: 999,183
Estimated Unemployment Rate: 5.1%
Median Household Income: $93,975
Average Household Net Worth: $695,242
Property Tax as % of Income: 2.4%
Total Days Above 20°C: 117
Crime Rate Per 100,000:* 3,782
Family Doctors Per 100,000:* 142
See more stats about Ottawa, Ont. here.
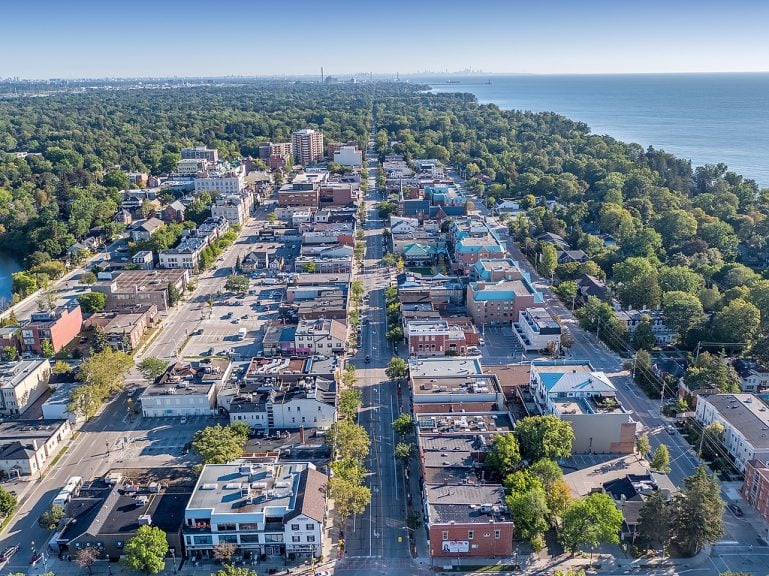
1. Oakville, Ont.
Rank in 2017: 15
Population: 209,039
Estimated Unemployment Rate: 5.7%
Median Household Income: $112,207
Average Household Net Worth: $1,742,036
Property Tax as % of Income: 2.6%
Total Days Above 20°C: 107
Crime Rate Per 100,000:* 2,133
Family Doctors Per 100,000:* 91
See more stats about Oakville, Ont. here.
*See the 2018 Canada’s Best Places to Live methodology for more details about this category.