A 338Canada analysis: Where the Conservatives lost
Philippe J. Fournier: A riding-by-riding breakdown of the election results shows the Conservatives’ biggest weaknesses—and a troubling urban-rural divide

Scheer speaks at an election night rally in Regina on Oct. 22, 2019 (GEOFF ROBINS/AFP via Getty Images)
Share
Much will be written and said about the fact that the Conservative Party of Canada (CPC), although it came 36 seats short of the Liberal total, won the popular vote in the 2019 Canadian federal election. Losing the seats race while winning the popular vote is not the norm in our electoral system, but it does happen: Joe Clark’s PCs did it in 1979; and just last year, the New Brunswick Liberal party of Brian Gallant won the popular vote by six points in the NB general election, but lost the seat count (by a single seat) against Blaine Higgs’ PCs. Again, it’s rare, but it does happen.
The CPC increased its national vote share from 31.9 per cent in 2015 to 34.4 per cent in 2019, a respectable increase of 2.5 points from coast to coast. However, as we will see below, the CPC increase of support was not at all uniform and, more importantly, did not occur where it was needed.
When we break down the election results by electoral district, we notice the Conservatives increased their vote share in 194 of 338 electoral districts (57 per cent) and lost ground compared to 2015 in the remaining 144 districts (43 per cent).
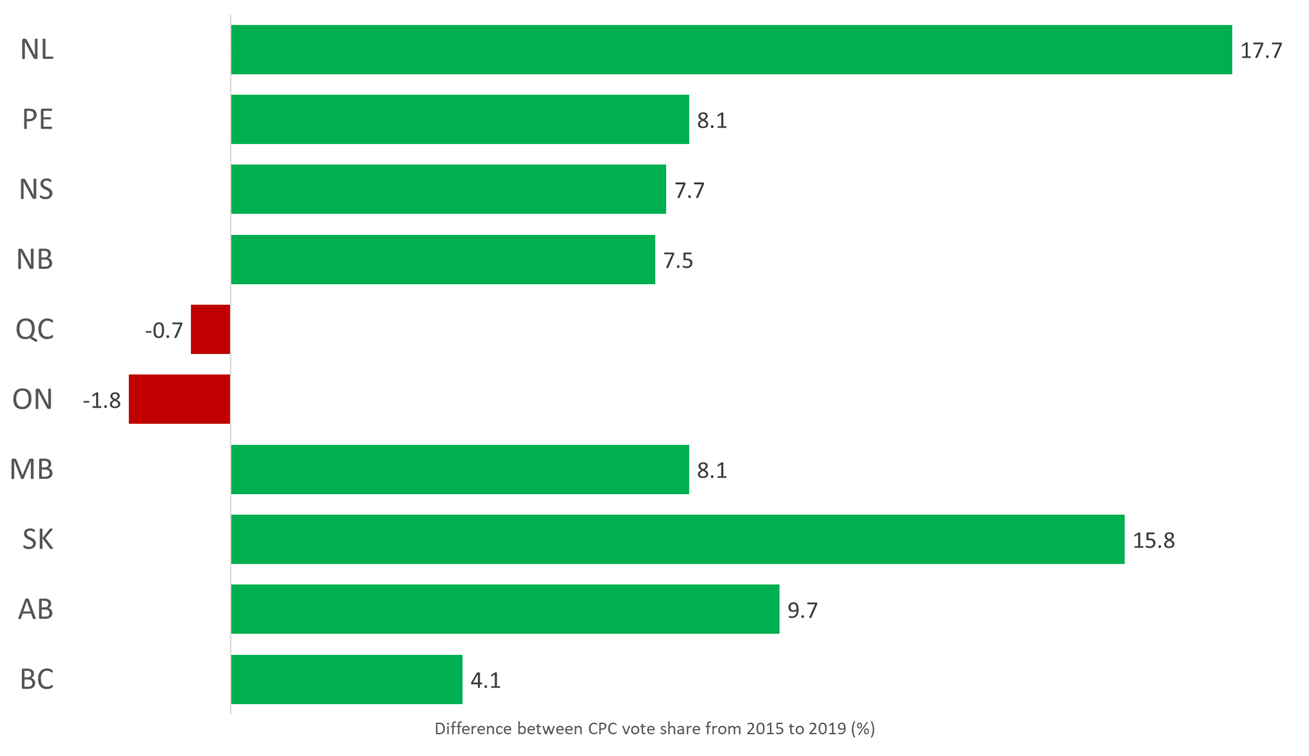
However, out of those 144 districts where the Conservatives lost ground, no fewer than 139 are in Quebec and Ontario. The remaining five are located in B.C.’s Lower Mainland.
Together, Quebec and Ontario hold 199 federal electoral districts and the Conservatives lost ground in 139 of them (70 per cent) compared to 2015. That’s the election right there for the Conservatives. Losing ground in 70 per cent of districts in the two most populous provinces in the country is a sure path to defeat.
Here is the variation of CPC support by province from 2015 to 2019:
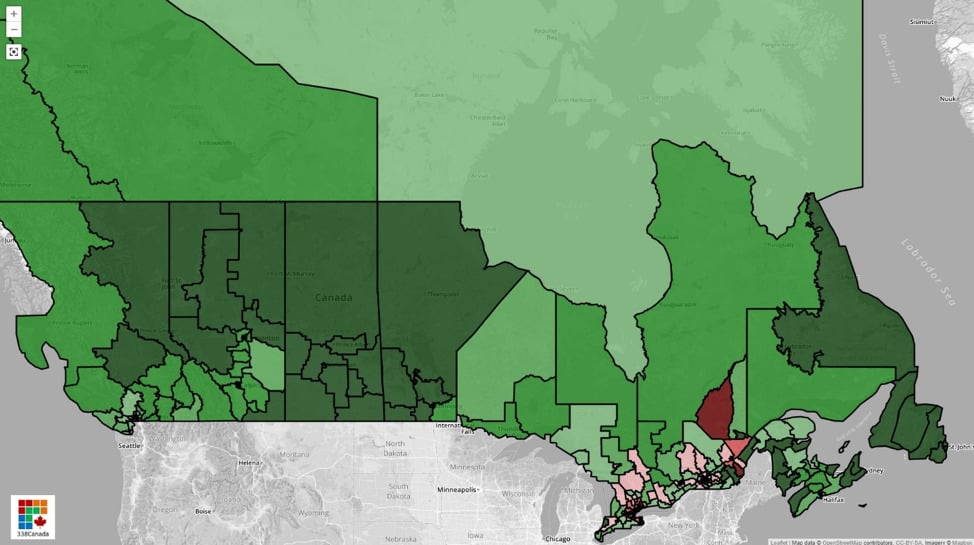
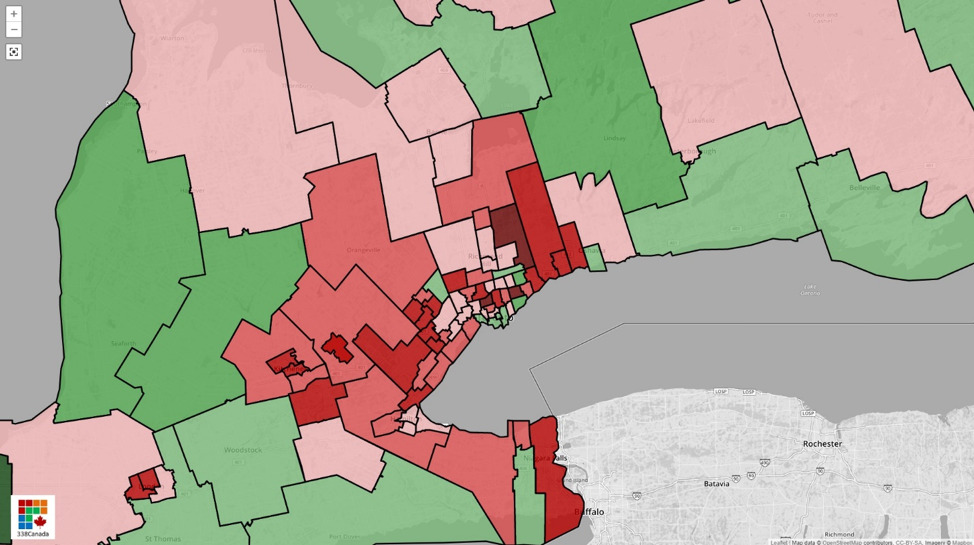
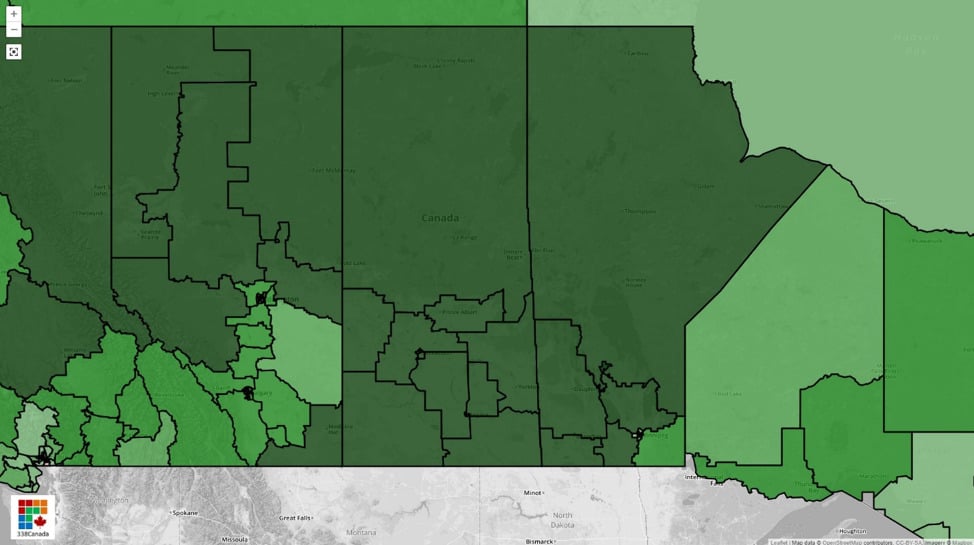
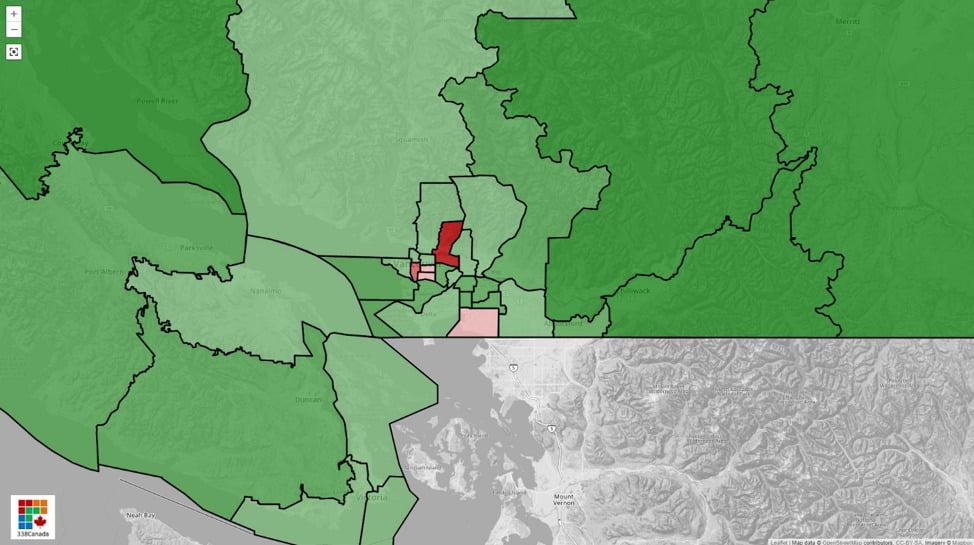
I drew an interactive map of the Conservative swing from 2015 to 2019. The following images are screengrabs of this map: Green means the CPC vote share increased from 2015; Red means it decreased. The darker the shade, the greater the swing between the elections.
At first glance, the map looks almost entirely green:
Naturally, we have to zoom in to see the complete picture, because it is essentially in urban Canada that the Conservatives struggled most.
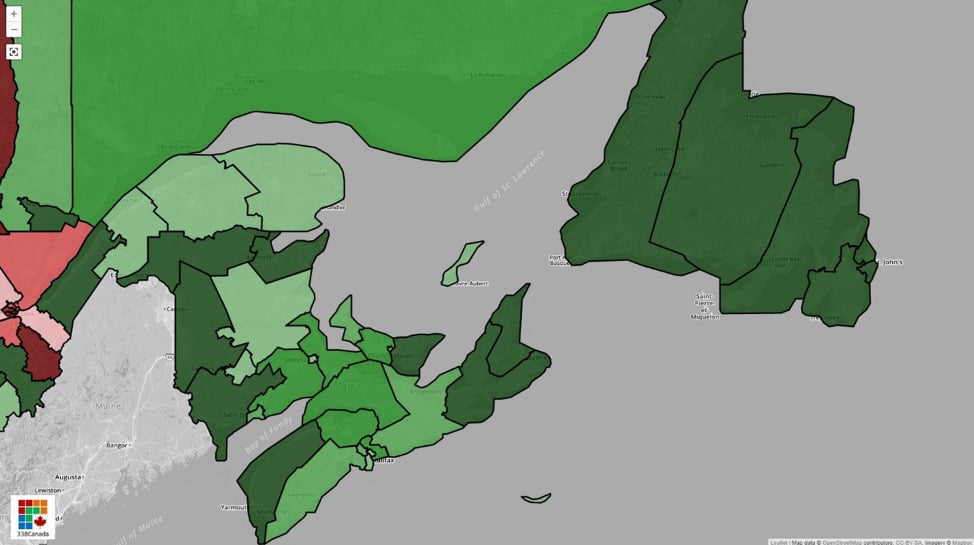
In the Atlantic provinces (see below), the Conservatives increased their vote share in all four provinces and all 32 electoral districts. However, this only resulted in a modest gain of four seats: Three in New Brunswick and one in Nova Scotia. This shows just how far behind the CPC had fallen throughout Atlantic Canada in 2015.
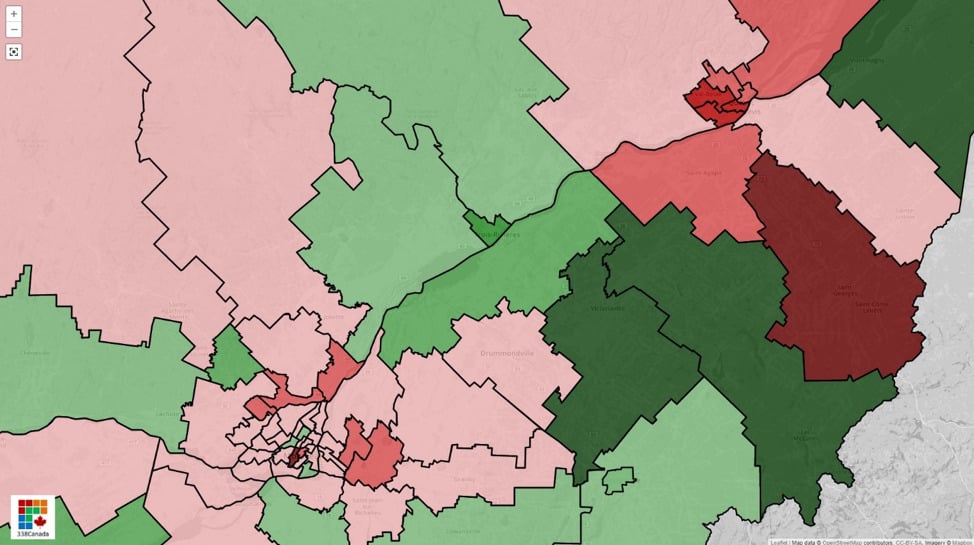
Now let’s take a look at southern Quebec. On the upper-right corner (see image below), we notice the CPC lost ground in every single district of Quebec City – a renowned Conservative hotbed in the province. Two districts of the Quebec City region went from CPC to BQ in 2019: Beauport-Limoilou and Beauport-Côte-de-Beaupré-Île d’Orléans-Charlevoix.
In the lower-left corner, we see that the Conservatives decreased their vote share in almost every suburban district of Montreal (the 450). Those voters had gone overwhelmingly towards the right-of-centre CAQ in last year’s Quebec provincial election – and so there were high hopes from the Conservatives to lure those voters to their fold. In the end, it did not happen: The Bloc Québécois won a majority of those districts and the CPC vote share decreased significantly.
We now move to Toronto and the Greater 905. In 2015, the Liberals had won 49 of those 55 districts (including all 25 in Toronto).
In 2019? The Liberals, once again, won 49 of 55. The Conservatives took Aurora–Oak Ridges–Richmond Hill, but lost Milton. However, beyond the seat totals, the Conservatives lost ground in 47 of those 55 districts compared to 2015.
Andrew Scheer needed net gains in the region to win the election, and he could not even match the 2015 CPC support. Some analysts will see in this decline of support a clear “Doug Ford effect”, but others will opine on a grander urban Canada problem for the CPC.
From Sault Ste. Marie to Cloverdale–Langley City, B.C., the Conservatives increased their vote share in every single district (see below).
However, in Manitoba, Saskatchewan, and Alberta, even though the Conservatives increased their vote share in every district—and by double digits in many cases— the net gain for the Conservatives was only 10 seats (two in MB, four in SK, and four in AB).
Finally, the Conservatives fared better than in 2015 in 37 of 42 B.C. districts. All five remaining districts are in the Lower Mainland – notably in Vancouver Granville (where independent candidate Jody Wilson-Raybould won her re-election bid) and Burnaby North-Seymour (where the Conservatives dropped their candidate after the October 1st deadline, essentially giving up on winning the district altogether).
As was mentioned in a previous column during the campaign, some will see the 2019 election result map and see an East-West divide in Canada, which, let’s emphasize, is not a new phenomenon. But perhaps the true divide lies between the urban and rural regions of Canada—something we can observe in several western democracies.
Case in point: among the 60 electoral districts with the highest population density in Canada, the Conservative won a grand total of zero of them (Liberals 50, NDP 8, BQ 1, IND 1). See complete list of electoral districts ranked per population density here.
Watch for more analysis of the election results in the coming weeks.
CORRECTION, Oct. 27, 2019: An earlier version of this story misstated the Conservative seat gain in Saskatchewan
