A new 338Canada projection has the Tories safely in majority territory
Philippe J. Fournier: The latest electoral model has the Conservatives winning 174 seats, while the Liberals face big losses in Ontario and Atlantic Canada

Scheer jokes during his speech at the annual Press Gallery dinner in Gatineau, Que., on Saturday, May 4, 2019. (THE CANADIAN PRESS/Adrian Wyld)
Share
Since Ottawa was hit by the SNC-Lavalin storm in early February, a staggering number of opinion polls have been conducted. Data nerds like myself are not complaining, but so many polls taken when public opinion is in flux creates a fair amount of noise—which may lead to considerable confusion for voters.
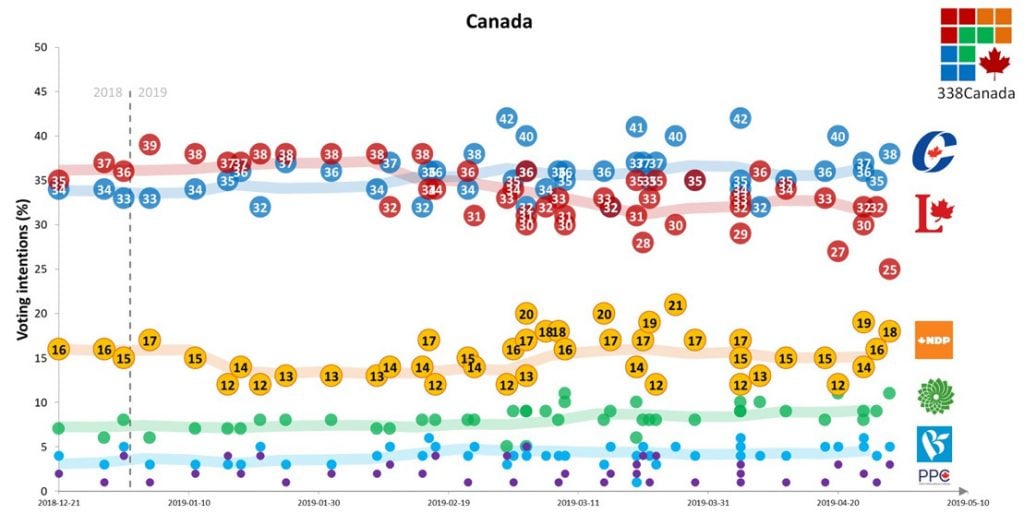
Case in point: polls in the past month alone have ranged from 13 point CPC leads (Angus Reid, Léger) to a 4 point LPC lead (Innovative Research), with other polling firms somewhere in the middle (namely: Ipsos, Nanos and Campaign Research). Obviously, not all these polls can be correct in the same time frame, but it’s by taking them all together and careful weighing the regional breakdowns that we can hope to reduce the noise and see the actual data.
Here are the federal polls published since the end of 2018:
The complete list of all federal polls can be found on this page.
To calculate the following 338 projection, polls are carefully weighted by field date, sample size, and broken down per region of the country. The 338 model also includes demographic data from the Canadian census in its simulations to link the movement of public opinion per electoral district. Historical data of past elections is also taken consideration in the model. Details of the 338 methodology and past performance of the model can be found here.
Readers should know that this is not a prediction of the outcome of the next election, but rather a projection of where the major parties stand according to current data. When/if the data changes, the projection then adjusts itself.
With 169 days until the federal election, here is the 338Canada electoral projection for May 5th 2019.
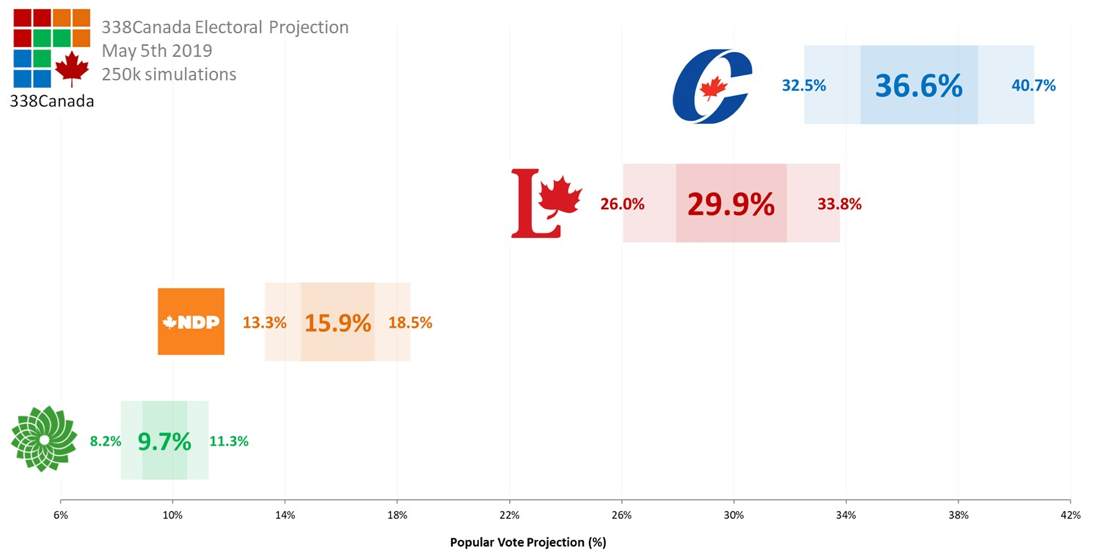
Popular Vote Projection
The Conservative Party of Canada leads the way with an average support of 36.6 per cent nationally (the projection 95 per cent confidence intervals are indicated on the graph below). Although federal voting intentions appeared to show a tightening gap between the CPC and LPC in the past weeks (coinciding with the SNC-Lavalin saga fading out of the news cycle), the latest polls published in the past days have propelled the CPC alone in first place.
The Liberal Party of Canada falls to an average of 29.9 per cent, its lowest level since the 338 tracking began in October 2018. The latest data made available indicates an erosion of support for the LPC from coast to coast—even in Quebec and Atlantic Canada, which both appeared to be Liberal strongholds only months ago.
Even with the Liberals sliding in voting intentions, the New Democratic Party still can’t seem to get any traction. Its average support stands at 15.9 per cent—a level that would most likely mean that many current NDP districts could change colour next fall.
The Green Party of Canada continues its slow, but steady ascent in voting intentions with an average of 9.7 per cent this week. However, as we will see below, this modest hike in public support does not necessarily translate into significant gains in the seat projection.
The Bloc québécois stands at an average 4.7 per cent (20.2 per cent in Quebec) and the People’s Party of Canada, 2.9 per cent.
How do these voting intentions translate into seats? Let’s crunch the numbers.
Seat Projection
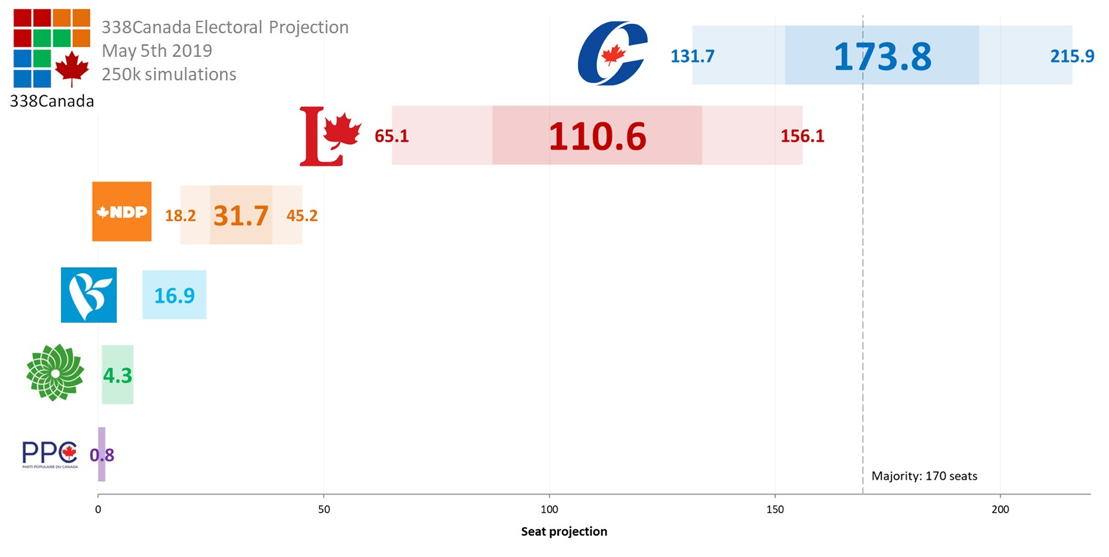
With such levels of public support, the Conservatives now hold a commanding lead over their rivals in the seat projection. On average, the CPC wins 174 seats per simulation—just above the 170 seat threshold for a majority at the House of Commons.
The Liberals fall to an average of only 111 seats, with all but about a dozen seats west of the Ontario-Manitoba border.
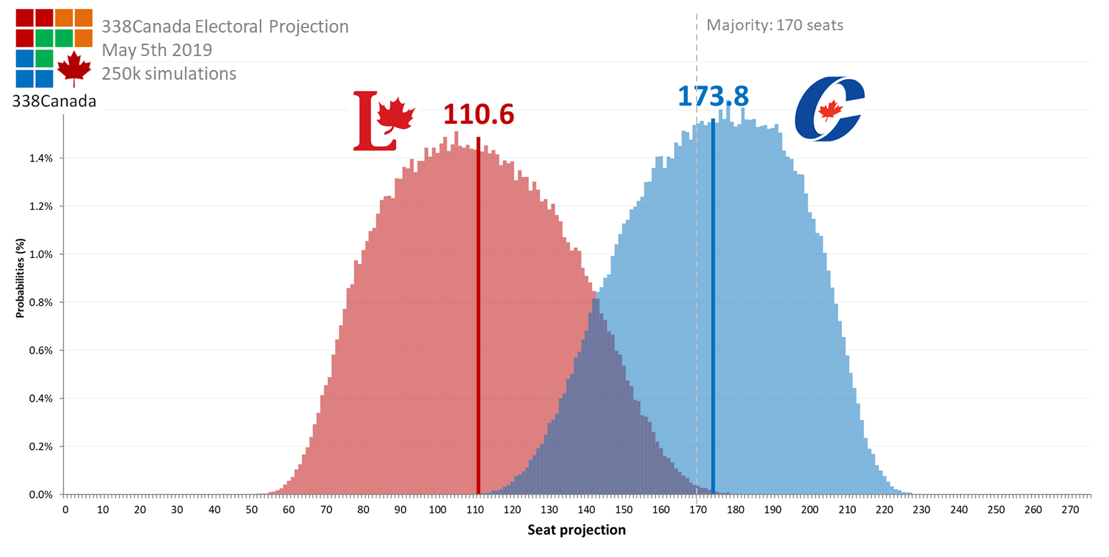
Below are the seat projection probability densities for the CPC and LPC. The higher the bars, the more likely the outcome:
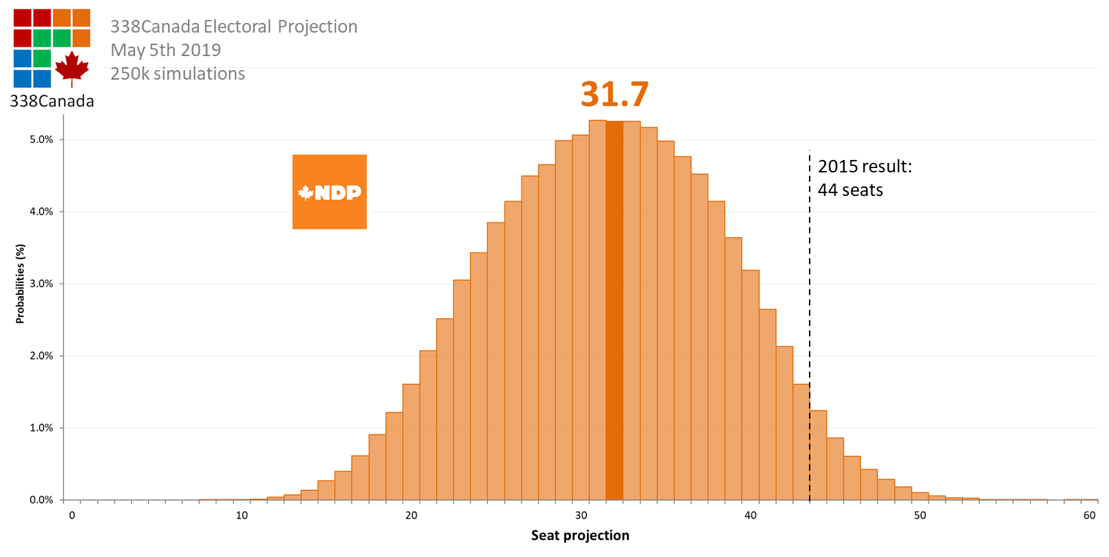
The NDP climbs modestly this week in the seat projection, which is more due to the Liberals’ slide than to a hike in NDP support. On average, the NDP wins 32 seats:
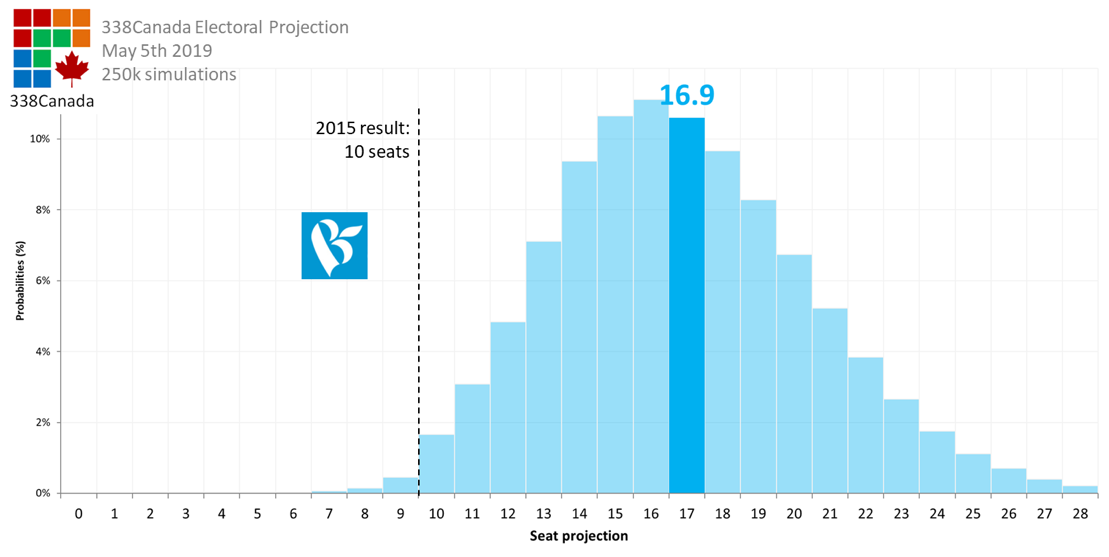
The latest data in Quebec shows a modest, but significant climb for the Bloc québécois. With about 20 per cent of support in Quebec, Yves-François Blanchet’s party wins an average of 17 seats per simulation.
Odds of Winning the Most Seats
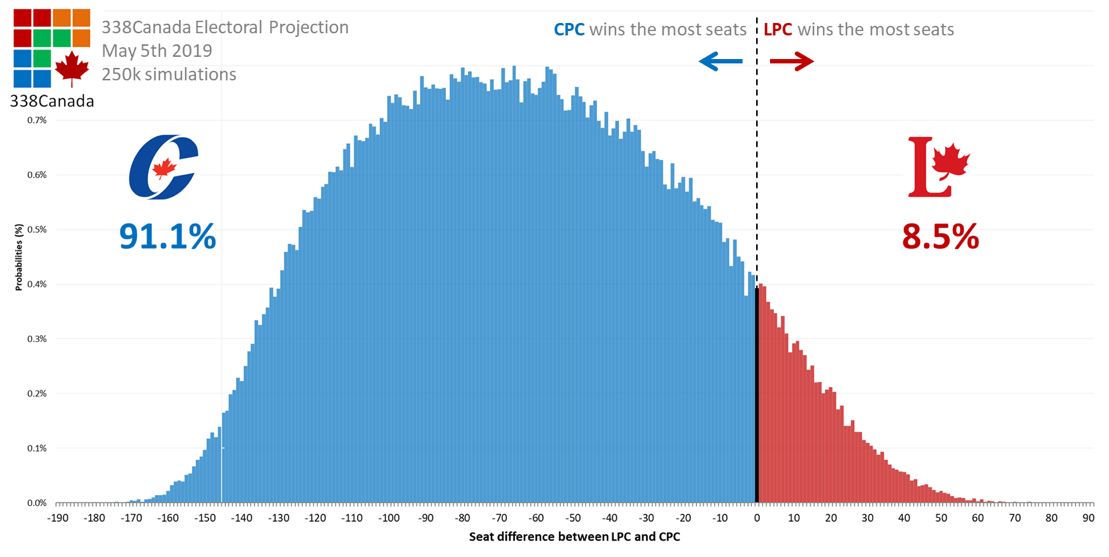
With the data presented above, the 338 model compiles the outcome of 250,000 general election simulations. Since only the Liberals and Conservatives have a shot at winning the most seats (according to current data), we may graph the probability density of the seat total difference between the CPC and LPC (see graph below) and thus evaluate the odds of either party winning the election:
According to this week’s numbers, the Conservatives win the most seats in a little more than 9 out of 10 simulations (91.1 per cent). In fact, the CPC wins 170 seats or more in almost six of 10 simulations (58 per cent).
Regional Breakdown
- In the Atlantic provinces, after leading by 20 points or more for the better part of the last three years, the Liberals are now in a statistical tie with the Conservatives, with the CPC holding a slight edge in both the popular vote and seat projections.
- In Quebec, although the Liberals are still in front (mostly in Montreal, Laval and in Western Quebec), it is by no means a dominant lead, as the non-Liberal vote is splintered between the Bloc, the Conservatives, the NDP and the Greens. The Conservatives dominate the projection in the greater Quebec City region.
- We also measure a statistical tie in Ontario, with the Tories holding the edge. Liberals are still projected in front in Toronto and Ottawa, but the 905, Centre of Ontario and Southwestern Ontario are dominated by the CPC.
- In the Prairies (Manitoba/Saskatchewan), the Conservatives are projected in the lead, except for a handful of districts in Winnipeg.
- In Alberta, the Conservatives are expected to paint the entire province blue. All but one of the 34 districts are projected safe or likely CPC (the exception would be Edmonton-Strathcona).
- Finally, British Columbia is where we have measured the highest polling fluctuations of late, so there is a high level on uncertainty. On average, the CPC is projected ahead in the greatest number of districts, but the NDP and Greens are projected favourites for the Vanvouver Island districts, and the Liberals still win a their fair share in Greater Vancouver.
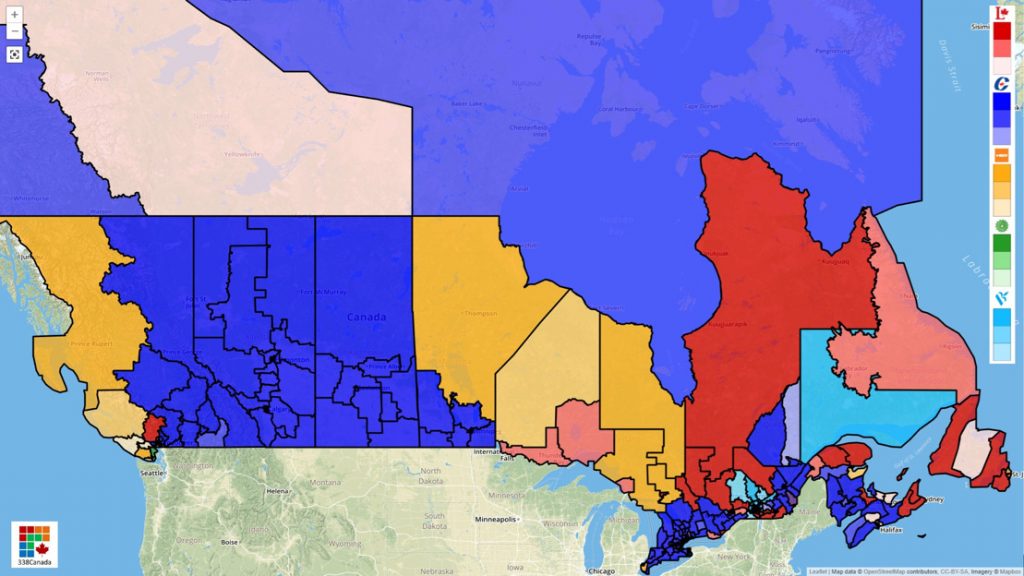
The complete map of the 338 Projection can be found here.
We are still more than five months away from election day, so the Conservatives still have plenty of time to squander this lead. However, in analyzing these numbers and especially the projection map, it is increasingly difficult to see a path towards a second straight majority for the Liberals.
In 2015, the Liberals swept the Atlantic provinces, won 80 seats in Ontario and ended up at 184 seats in total—only 14 seats above the majority threshold. Yet, current numbers suggest that the Liberals could lose a dozen seats in Atlantic Canada and at least 30 seats in Ontario. From this point, whatever happens in Quebec or B.C. cannot push the Grits past the majority line.
Moreover, with the Bloc at 20 per cent in Quebec and the Greens polling as high as ever in key parts of the country, not only are the Liberals not headed towards a majority, but they could very well be sent back to the opposition benches after a single term in power—as the results of this projection clearly show.
As Paul Wells wrote last week: “Politics isn’t physics, trends aren’t natural laws, and absolutely anything could happen before October”, and as a physicist, I fully concur. But recent provincial elections in Ontario, Quebec and Alberta lead to majority wins by parties that had been leading in the polls several months before election day.
Sometimes, when an electorate has made up its mind, whatever happens in a campaign is nothing but noise.
In hindsight, we understand now that the writing had been on the wall for quite a while for Kathleen Wynne, Philippe Couillard and Rachel Notley. We may just be seeing the same trend at the federal level.
We will see. Polls take snapshots of the present, not the future.
Philippe J. Fournier is the creator of 338Canada.com, Qc125.com, a regular contributor to L’actualité magazine and a professor of physics and astrophysics at Cégep de Saint-Laurent in Montréal. Watch Maclean’s for all his vote projections for the 2019 federal election.
