The Maclean’s-Pollara Ontario election poll: Ford’s advance edge
Among the 18.8 per cent of respondents who say they have already voted, 43 per cent voted PC, compared to 36 per cent for the NDP

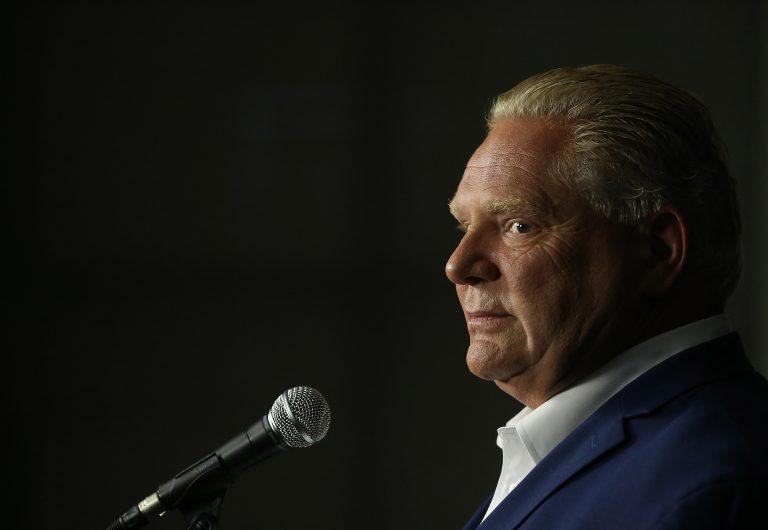
PC Leader Doug Ford takes questions in a post-debate scrum. (Steve Russell/Toronto Star via Getty Images)
Share
[widgets_on_pages id=”ontario_2018_election_live”]
A new poll, with results as of June 5, is available here
The Maclean’s-Pollara tracking poll is still way too close for any certainty about the outcome of Thursday’s election, but with only two days left to go, Doug Ford and the Progressive Conservatives seem to be consolidating their advantage.
READ MORE: Check out each party’s position on every major issue in our platform guide
The PC lead among decided voters is still within the margin of error, at 39 per cent to 37 per cent for the NDP and 17 per cent, a catastrophically low level of support, for the Liberals. In the last two days of rolling polls, Liberal support is down three points, PC support up two, NDP unchanged.
Perhaps the most striking feature in today’s report is that among the 18.8 per cent of respondents who say they have already voted, 43 per cent voted PC, compared to 36 per cent for the NDP and 15 per cent for the Liberals. This represents a baked-in advantage for the PCs: the NDP would have to do commensurately better on Thursday to make up for that advance lead. It also suggests an enthusiasm gap that has, so far, translated into real differences in votes cast. And because total voter turnout in the last two elections was only a few points on either side of 50 per cent of eligible voters, the 18.8 per cent looms even larger.
This latest sample in the Pollara mixed-method (phone and online) survey was conducted from June 1 to 4. By now 3/4 of the survey was taken after Kathleen Wynne announced on Saturday that she has concluded she won’t be premier after the election. Liberals are campaigning as hard as ever for local votes, but by most measures, Pollara finds Liberal support declining rapidly: down 3 points in two days in popular vote; down 8 points in two days in Toronto, leaving a virtual NDP-PC tie in the province’s metropolis; down 4 points in a day in Central Ontario (the area around Barrie, Peterborough and Parry Sound) and 6 points in a day among seniors. In most of those cases, the immediate beneficiary of Liberal decline seems to be the PCs.
A note on methodology
- This Methodology & Data Disclosure Brief features the third wave of results of Pollara Strategic Insights’ final week tracking survey for the Ontario Election, which involves daily polling updates based on the most recent 4 days of mixed-mode survey interviewing.
- This is the third update, based upon a mixed-mode sample of N=1,083 adult Ontarians who self-identified as eligible to vote in the Ontario Election. The survey was conducted from June 1 to June 4, 2018. Of the 1,083 surveys conducted:
- 297 were conducted via a live-interviewer CATI telephone survey approach, with 26 per cent of the interviews being conducted via cellphone.
- 786 were conducted via an online survey approach, among verified members of a research panel.
- Because the sample for this survey included both probability (telephone) and non-probability (online) samples, a margin of error cannot be applied to it. The online sample is not probability-based because respondents self-selected for participation in a verified research panel. Sample surveys and polls of all types may be subject to multiple sources of error, including, but not limited to sampling error, coverage error, and measurement error. If the entire N=1,083 sample were conducted among a probability sample, it would carry a margin of error of ± 3.0 per cent, 19 times out of 20.
- As it is probability sample, the telephone portion of the sample (n=297) carries a margin of error of ± 5.7 per cent, 19 times out of 20.
- The data are statistically weighted to ensure the regional composition province-wide and within region to ensure age and gender composition reflects that of the Ontario adult eligible population using information from the 2016 Census and accounting for older Ontarians’ increased propensity to vote based on an analysis of Ontario’s election performance relative to federal elections. Based upon our analysis, the composition of the electorate over the age of 55 would range between 43 and 48 percent.
- In this report, results are expressed as percentages unless otherwise noted. Results may not add to 100 per cent due to rounding or multiple responses. Net results cited in the text may not exactly match individual results shown in the charts due to rounding.