
A final 338Canada U.S. election projection: Where the race will be won or lost
Many people I read online in the past week have been expressing desire for certainty in these troubled times. "Please reassure us". "What do the numbers really say?"
"Will Trump get beaten in a George McGovern- or Walter Mondale-type landslide?", or sometimes "Can Trump pull another 2016-style upset?"
The honest and numbers-based answer is highly unsatisfying: "There is a range of possible outcomes."
Since late spring, I have incorporated more than 1,400 polls in the 338Canada U.S. presidential model. While not all polling firms are created equal and we have to use caution with some dubious firms, it is possible to detect some clear tendencies through all the noise. Unless we witness a truly historic polling miss, Joe Biden will win the popular vote in the 2020 presidential election, marking the seventh time a Democratic candidate wins the popular vote in the last eight presidential elections (the exception being George W. Bush in 2004).
But this does not tell us much, now does it.
Related Posts

’The best country for Trump to be contained in is the one he lives in now’

Trudeau and Biden: Getting to know all about you
Even though national polls do serve some purpose in U.S. presidential election modelling, the state polls carry far more weight in the calculations, since the winner of the presidential election is determined by the Electoral College.
The following is the projections by state from the 338Canada model. Are these numbers final? Well, almost: New polls are bound to be published later tonight and the model will be updated until late Monday night, although it is unlikely these projections will move much. We will adjust accordingly.
Let us start with states labelled either Safe or Likely.
Safe Democratic: California, Connecticut, Delaware, District of Columbia, Hawaii, Illinois, Maryland, Massachusetts, New Jersey, New York, Oregon, Rhode Island, Vermont, Washington, for 182 electoral votes.
Likely Democratic: Colorado, Maine, Minnesota, New Hampshire, New Mexico, Virginia for 45 electoral votes.
Total Democratic electoral votes so far: 227.
Safe Republican: Alabama, Arkansas, Idaho, Kentucky, Louisiana, North Dakota, Oklahoma, West Virginia, Wyoming, for 53 electoral votes.
Likely Republican: Indiana, Kansas, Mississippi, Nebraska, South Dakota, Tennessee, Utah for 48 electoral votes.
Total Republican electoral votes so far: 101.
Here is the map:
It would constitute an enormous—even shocking—surprise should any of these states switch colours after election day. In fact, none of these states would change parties from the 2016 final results. Although Minnesota could be closer than its 2016 result, polls suggest it will probably remain in the Democratic column.
Now let’s add the leaning states. These are states where we can project a favourite according to the states polls released in the past weeks, but where a modest polling error could still change the outcome.
Leaning Democratic: Michigan, Nevada, Pennsylvania, Wisconsin for 52 electoral votes, bringing the total to 279 electoral votes for Joe Biden.
Leaning Republican: Alaska, Missouri, Montana, South Carolina for 25 electoral votes, bringing the total to 126 electoral votes for Donald Trump.
One note before we continue: the second district of Nebraska is leaning towards Joe Biden, which would give him an additional electoral vote. However, the 2nd district of Maine is a toss up (Trump won it in 2016) which would give Trump an extra electoral vote. For the sake of simplicity in this breakdown, we’ll consider these an even exchange—for now.
We notice that Joe Biden would then pass the 270 electoral vote-threshold to win the presidency. Nevada was won by Clinton in 2016, so the only "flips" needed for Joe Biden would be the Midwestern states of Wisconsin and Michigan, and the all-important 20 electoral votes from Pennsylvania.
Finally, let us add the toss up states. Polls from these states show the race will most likely end with a margin of two or three points between Biden and Trump at the most.
Toss ups: Arizona, Florida, Georgia, North Carolina, Iowa, Ohio, Texas, for a total of 133 electoral votes.
Here are the current margins of leaning and toss up states according to the 338Canada model as of this writing:
To win re-election, Trump’s path to victory goes through running the table among the toss up states, and making a come back by either winning both Wisconsin and Michigan, or winning Pennsylvania. How likely is this scenario? The 338Canada model has Donald Trump winning the Electoral College in 18 per cent of all simulations—odds similar to those of a dice roll.
As you can see on the graph below, odds of winning the Electoral College have not moved much since the middle of summer, as voting intentions both on the national scene or the key states have only fluctuated mildly during that period:
There is therefore a clear favourite for tomorrow’s presidential election: should polls be accurate (or at least within a reasonable margin of error), Biden will be the next President-elect by the end of the week. However, unlike some over-confident forecasters in 2016, we also understand that movements in voting patterns can be highly correlated between groups of states. But Trump does need a favourable swing in several groups of states where the vote may not necessarily be correlated: the Southwest, the Sunbelt, the Rust Belt.
On election night, I will keep my eyes on four specific states: Texas, Florida, Ohio and Pennsylvania.
If Trump loses either Texas, Ohio or Florida, his chances of re-election will drop to near zero. If he does win all three, then turn your attention to Pennsylvania, the most likely tipping point-state in the projections.
Before concluding: Regular readers of this column know that I usually stick to the numbers and focus my analysis on historical precedents and what the data indicates. Nevertheless, I am inclined to add that some of these states projections do not reflect my personal gut feelings. These are difficult to handle. Should the data be off by a few points in the direction of what my instinct had in mind, I would naturally go "Oh, I knew it." But the reality is: I didn’t know it. I was just expressing my biases—which can sometimes turn out to be correct.
During my university studies, I worked as a croupier in a casino to pay rent and tuition. Night in and night out, I saw people who just knew it right after it was too late. I witnessed the extremely irrational and very human behaviour of trying to see clear patterns out of pure randomness. Yes, hitting on 16 when the dealer shows a five in Blackjack is playing against the odds, and players who did just that would regularly infuriate people around the table. Most times, they busted and lost their money. But I clearly remember times when a player would then get a five to hit 21—and win a hand he would have lost otherwise. What would the player say then? "I just knew it!", but he didn’t.
These numbers above are riddled with uncertainty. Polls have uncertainty, and projections don’t always hit the mark. Trying to forecast an election without polls and going with your gut feeling may get you some praises when you are right, but, as with blackjack, you are most likely to lose in the long run. Studying scientific polls is like counting cards at blackjack: you will lose some hands, but you will win more in the long run. This is why the 338Canada model has correctly called the winner in 90 per cent of electoral districts over six Canadian elections.
Obviously, these projections are based on voting intentions. Should actual votes not be counted or should unexpected complications occur at the voting booths on Tuesday, we could be in for a few surprises. Unfortunately, these factors cannot be easily quantified—at least not before voting day. Let us hope for the sake of all Western democracies that the will of American voters be accurately translated into actual, counted votes.
The 338Canada U.S. presidential model will be updated until late Monday night (or very early Tuesday morning). Visit 338Canada for all the numbers, polls, and projections.
Related Posts

Was Jan. 6 the beginning of the end for America?
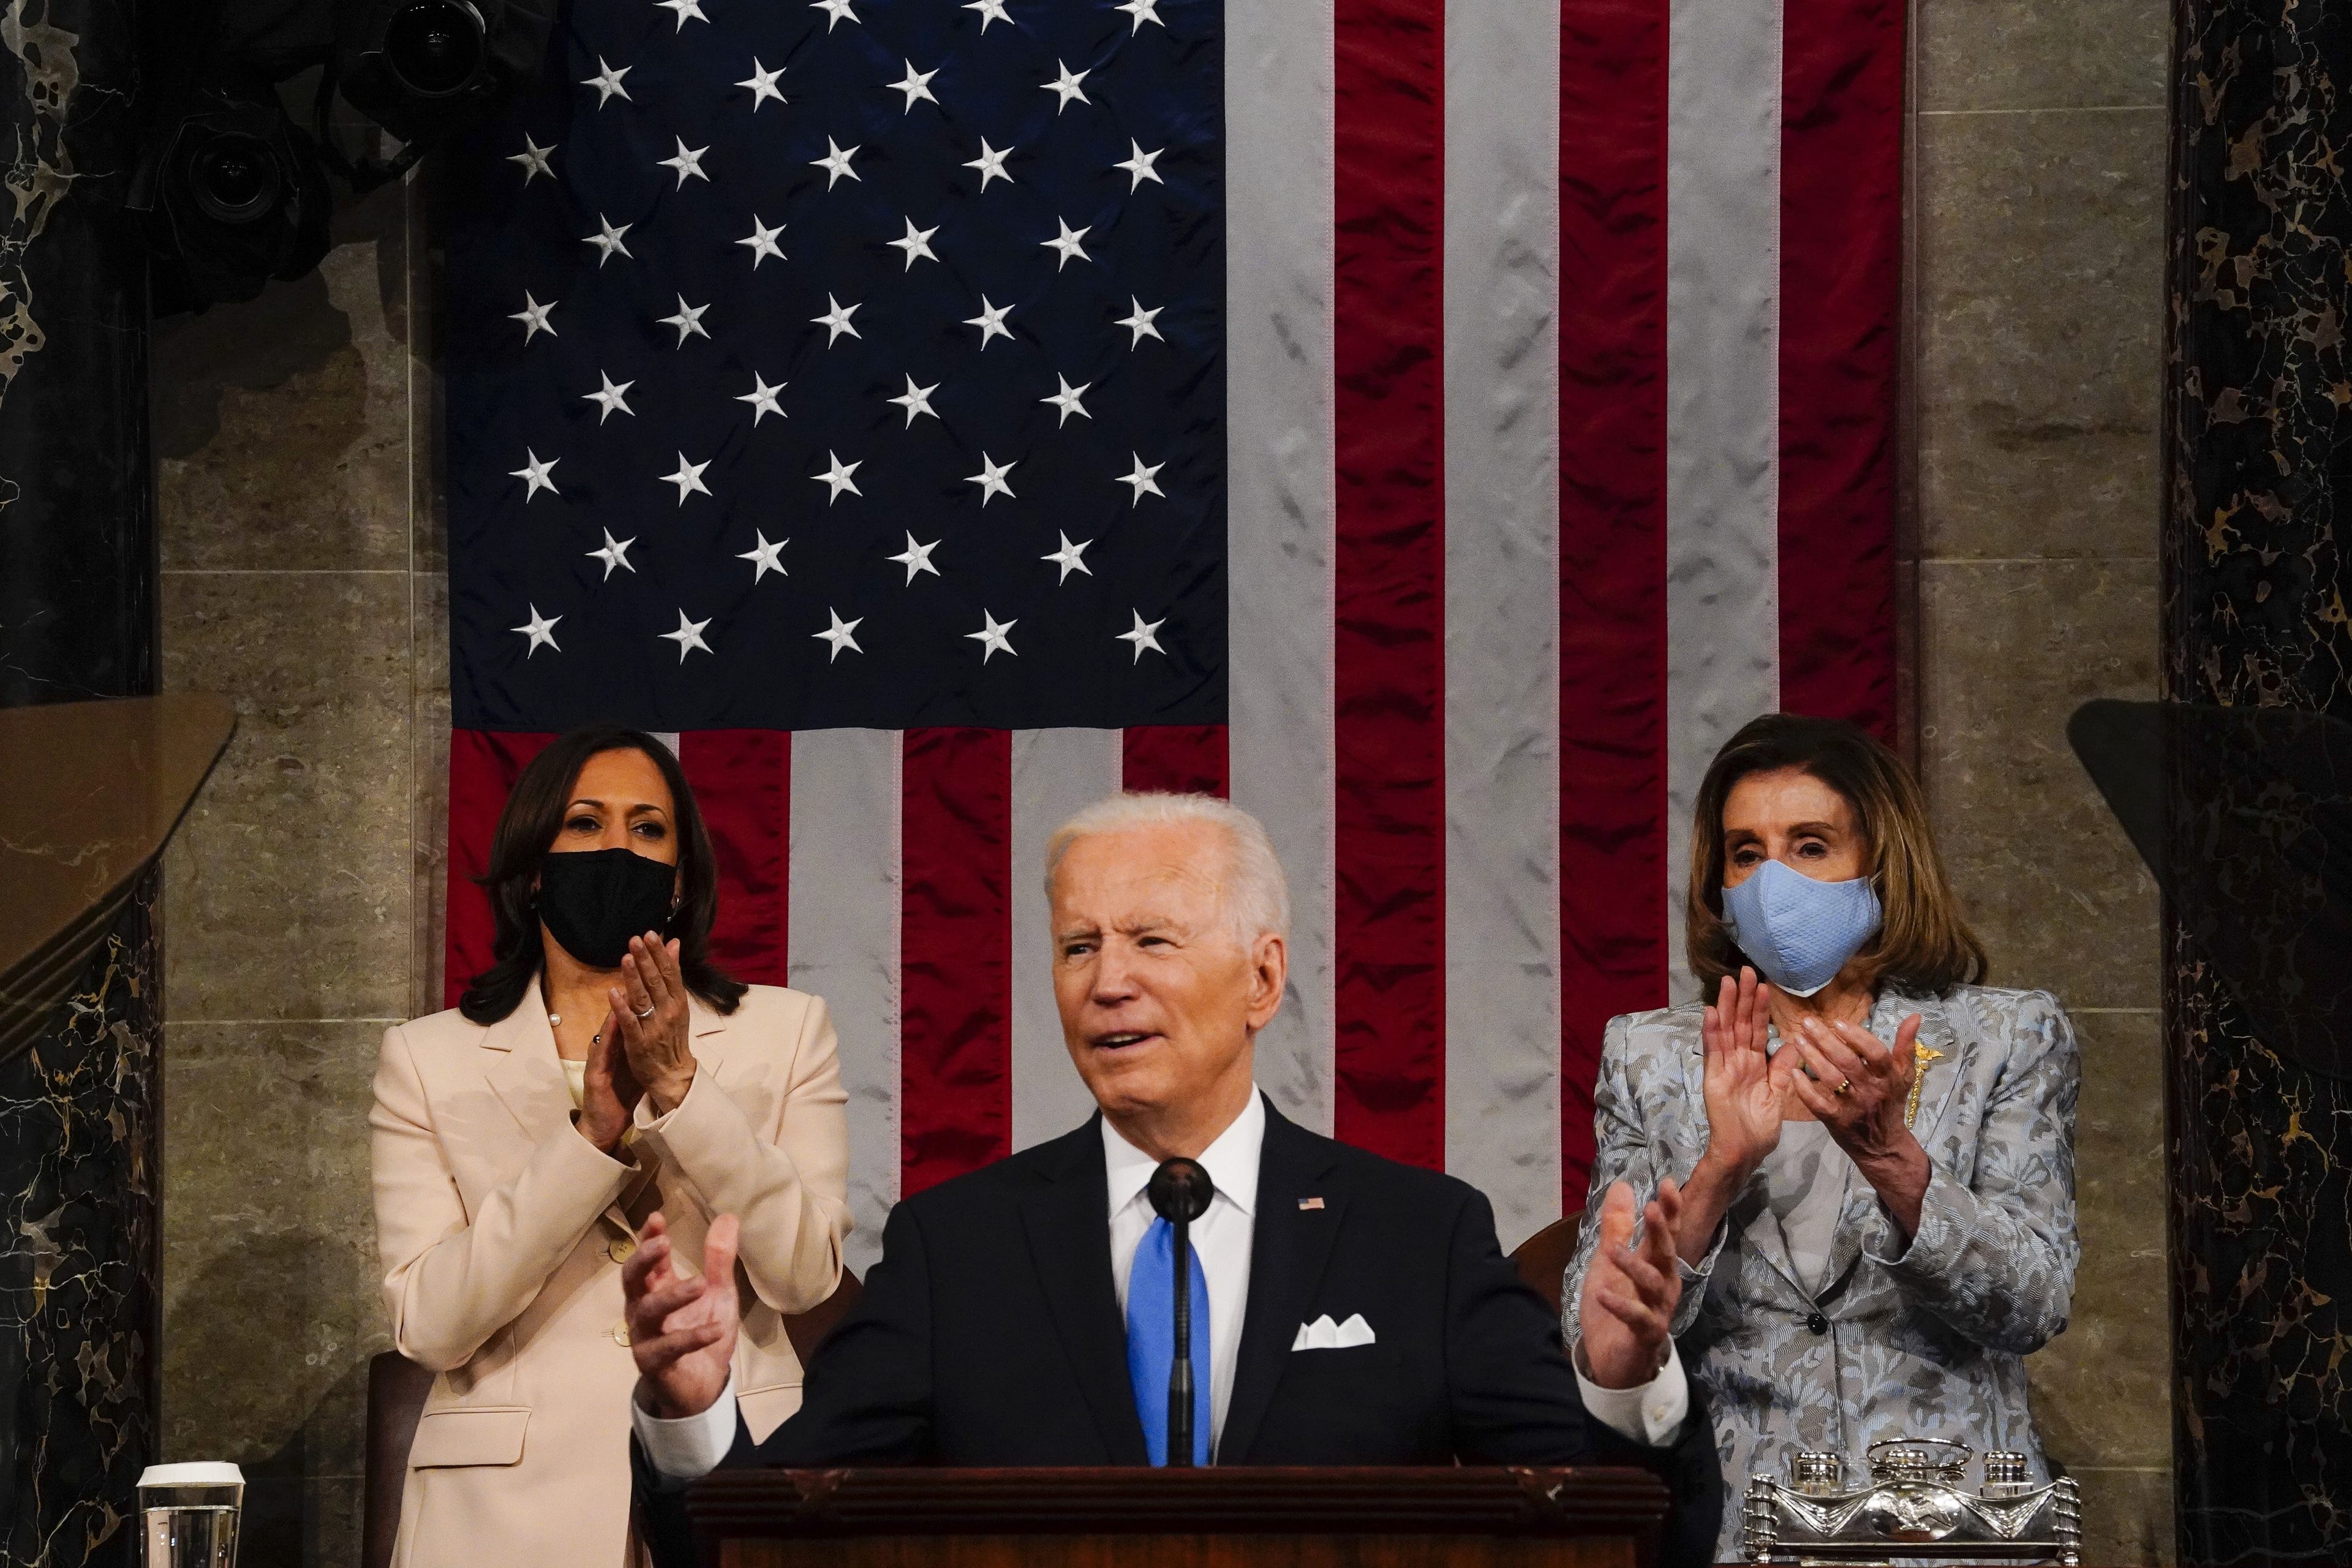
Kamala Harris and Nancy Pelosi make Biden’s address a historic moment

Maclean’s in Conversation: Dawn of the Biden era

Leaked document suggests U.S. court could undo Roe v. Wade
Get the Best of Maclean’s straight to your inbox.
Sign up for news, commentary and analysis. Join 60,000+ Canadian readers.