What Google data says about Canadian vs. U.S. social distancing efforts
Philippe J. Fournier: In reducing travel, Canada’s most populous provinces rank well. Trump-backing U.S. states are at the bottom.

People exercise on the lake shore path along Lake Ontario in Toronto on April 2, 2020 (CP/Nathan Denette)
Share
Last Friday, L’actualité magazine political bureau chief Alec Castonguay published an analysis of Google data released a few days ago on the mobility changes of people around the world due to the spread of the coronavirus.
Using its massive geolocation data (anonymously, Google says), the tech giant was able to measure an estimate of people’s mobility to places like restaurants, cafés, shopping centres (under “Retail and recreation”), grocery markets and drug stores (“Grocery and pharmacy”), parks and beaches (“Parks”), subways and train stations (“Transit stations”) and workplaces.
Unsurprisingly, when we compare the latest mobility data with Google’s baseline, which spans the five-week period from Jan. 3 to Feb. 6, 2020, we see a steep decline in mobility—mostly due to the spread of the coronavirus and of confinement measures implemented by provincial, state and national governments across the world.
From Google’s report:
As global communities respond to COVID-19, we’ve heard from public health officials that the same type of aggregated, anonymized insights we use in products such as Google Maps could be helpful as they make critical decisions to combat COVID-19. These Community Mobility Reports aim to provide insights into what has changed in response to policies aimed at combating COVID-19. The reports chart movement trends over time by geography, across different categories of places such as retail and recreation, groceries and pharmacies, parks, transit stations, workplaces, and residential.
I decided to take a deep dive in this data and, with Castonguay’s analysis as a starting point, I decided to add all 50 American states and the District of Columbia into the mix. As you will see below, the results are quite interesting. (This data was taken on April 5 and were last updated by Google on April 2, so the numbers could have slightly changed by the time you read this.) I decided to focus this analysis on two major trends: the mobility reduction towards 1) “Retail and recreation,” and 2) Workplaces.
First, let’s take a look at the mobility reduction towards retail and recreation, which includes, according to Google: “Mobility trends for places like restaurants, cafes, shopping centres, theme parks, museums, libraries, and movie theatres.” Here is the full list of all 10 Canadian provinces and 50 American states (plus the District of Columbia):
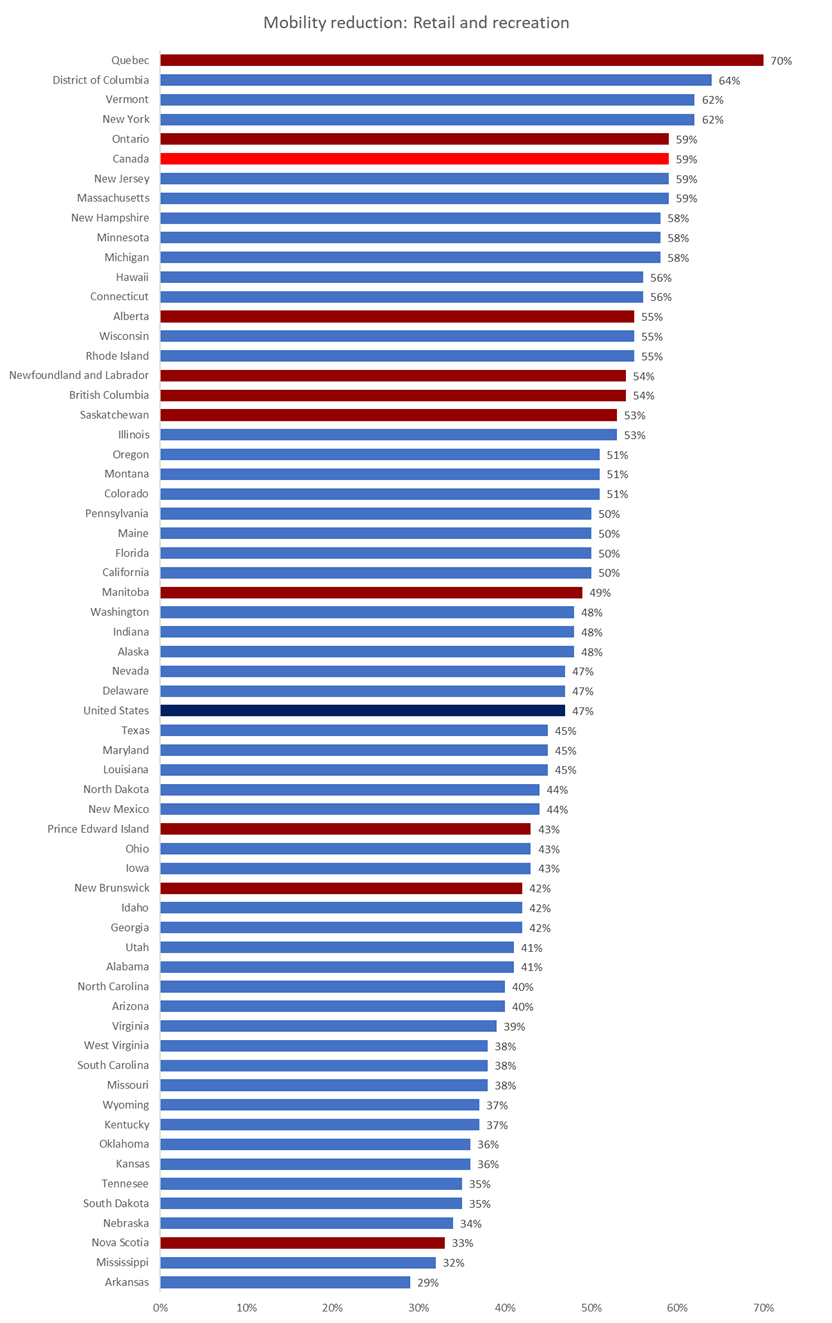
[Canadian provinces are indicated by dark red bars and American states, by blue bars.]
On the list’s top 10, we find Canada’s two largest provinces—Quebec in first and Ontario in fifth. While both these provinces are currently home to the highest numbers of confirmed cases of COVID-19 in Canada, it should nevertheless be encouraging to measure significantly lower mobility of late in these provinces. In theory, this shows many citizens are actually listening to government guidelines, and it should theoretically help to slow the spread of the virus in the coming weeks.
The remainder of the top 10 are five northeastern American states (Vermont, New York, New Jersey, Massachusetts, New Hampshire), two Midwestern states (Michigan and Minnesota), and the District of Columbia.
At the bottom of the list, we find Nova Scotia and nine American States: Arkansas, Mississippi, Nebraska, South Dakota, Tennessee, Kansas, Oklahoma, Kentucky and Wyoming. What these states have in common is rather conspicuous: they all have Republican traditions and voted for President Trump in the 2016 American election. Trump’s back-and-forth messaging on how Americans should handle the virus, from “it’s a political hoax” to “the country should reopen by Easter,” may have contributed to this trend.
As for mobility towards the workplace, Google measures that the four most populous Canadian provinces—Ontario, Quebec, British Columbia, and Alberta—are all near the top of jurisdictions where mobility has decreased the most in North America. Here is the full chart:
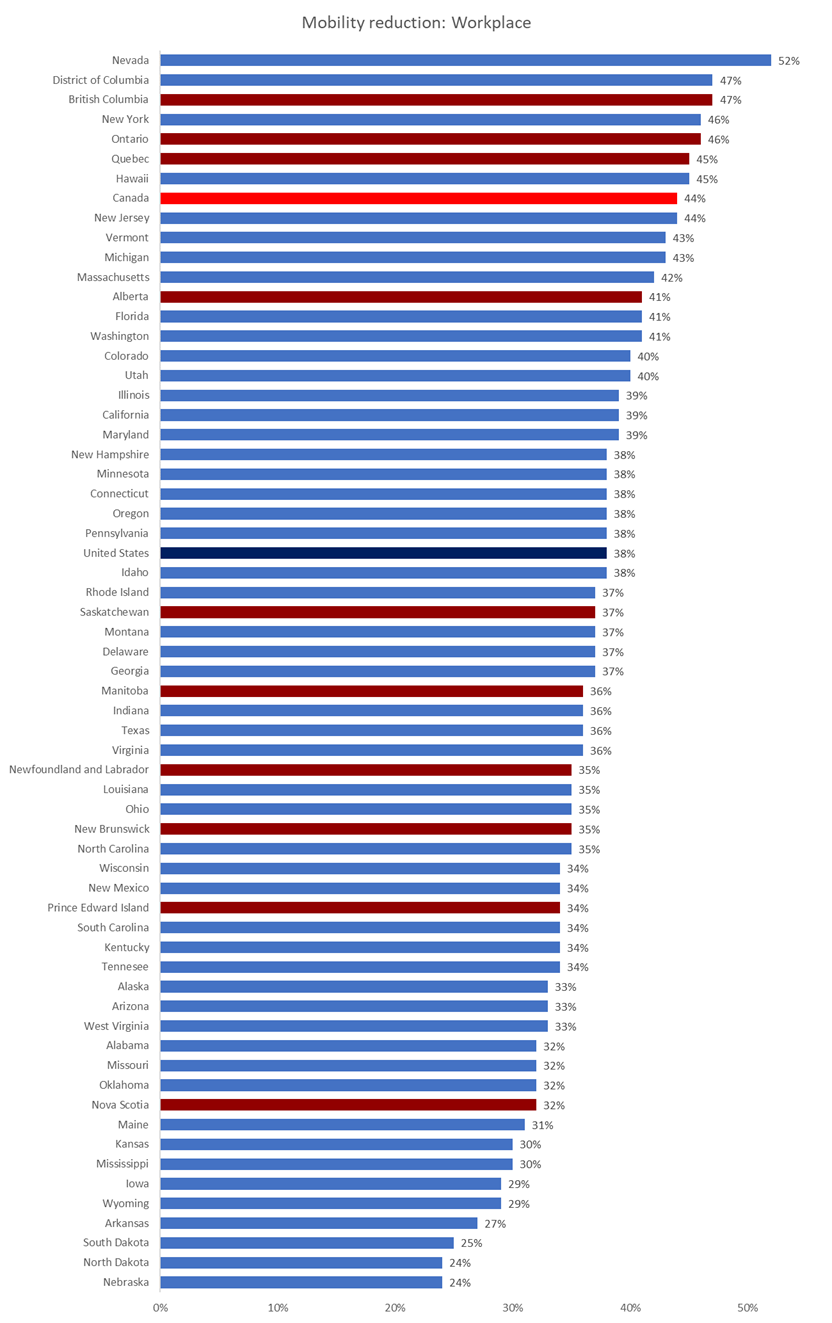
Once again, near the top of the list we find mostly northeastern and Midwestern states, with one exception: Nevada, in first place with an estimated 52 per cent mobility reduction towards workplaces. We can imagine the tens of thousands of jobs around the gaming and entertainment industry being hit the hardest, mostly (but not exclusively) around Las Vegas.
In states and provinces where mobility has fallen the most, we can cautiously hope to observe a flattening of the curve in the coming weeks—if citizens keep at it, obviously. In order to succeed, we have to see this challenge as a massive collective effort.
Let’s hope the rest of the continent catches up soon, for all of our sakes.
See Google’s Canadian report here and American report here.