Canada, the failed petrostate?
Canada hasn’t bet the economy on the energy sector. Not even close.
This Sept. 19, 2011 aerial photo shows an oilsands tailings pond at a mine facility near Fort McMurray, Alta. Researchers doubt that oilsands-damaged land can be restored to what it was THE CANADIAN PRESS/Jeff McIntosh
Share
You hear a lot about Canada being a petrostate from energy industry opponents. You might hear them say things like, “we’ve fallen into the staples trap.” You’ll also hear much the same story, although with a different implication, from the industry’s proponents who are quick to argue that our economy depends heavily on oil and gas, and without oil and gas we’d be short schools, hospitals, and other social programs (PDF).
I’ve taken to opening most public talks I give with a question: What is the share of oil and gas extraction in Canada’s GDP? I get a wide range of answers, generally in a range from 5-40%. The high numbers, in the 30s and 40s, tend to come both from the industry’s staunchest opponents and from those occupying the corporate towers of Calgary.
So, what do the data say? The data tell you that the energy share and oil and gas share of Canada’s GDP is dropping, that the growth in the energy sector has accounted for a much smaller share of Canada’s economic growth than most people seem to imagine, and that the oil and gas share of of total corporate taxes paid in Canada is smaller than its GDP share. The data also show little to no evidence of a Harper-effect. Let’s look at each of these in turn.
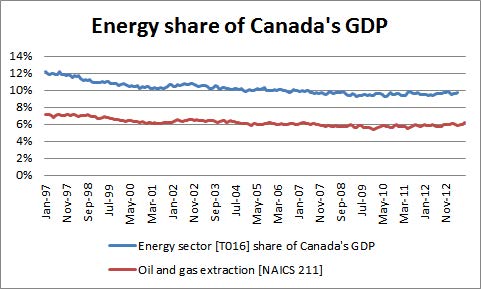
First, the GDP shares. Since 1997, the energy sector share of Canada’s GDP has declined – yes, declined – from over 12% to less than 10%. Over that same time period, oil and gas extraction has also declined slightly, from just over 7% to just over 6%. Data on unconventional oil extraction are not available over this entire timespan, but between January 2007 and August 2013, that subsector (which includes oil sands) increased from 1.3% of GDP to 2.0% in the most recent data available—rapid growth to be sure, at 7.5% per year, but on a small base.

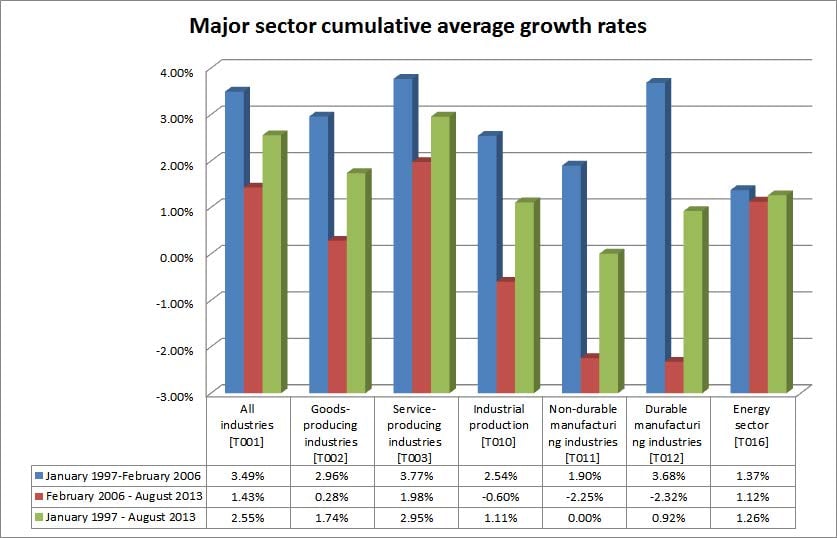
What about roles in economic growth? The graph below shows GDP growth rates by sector for 9+ years before Prime Minister Harper took office and the 7+ years since, as well as the cumulative average growth rates over the entire period. In all cases, the energy sector actually lags behind overall economic growth – something which was already implied given its share becoming less important. What is evident from this graph is the disparity in impacts from the economic crisis and beyond – manufacturing and good production in general are hard-hit, while services and energy are closer to historic levels. But, despite the soundbites, our economic recovery hasn’t been driven by the energy sector.

In terms of contribution to Canada’s economic growth, the growth in the energy sector was equivalent to 8% of Canada’s total GDP growth during the 2006-2013 period. The change in oil and gas sector GDP was approximately the same as the change in total energy sector GDP over that same period. For comparison, growth in public sector GDP was equivalent to 26% of total economic growth over the first 7+ years of Mr. Harper’s time as Prime Minister – perhaps we are more of a bureaucrastate than a petrostate?
What about taxation? The oil and gas industry has recently become a champion of social programs, schools, and hospitals. We are to believe that the expansion in oil and gas production has led to vast new tax revenue for governments through which to fund our social programs. That also doesn’t stand up very well, in Canada or in Alberta. Canadian data on tax base and revenue are updated with a longer delay than GDP data, so we only have data up to 2011, but they still tell an interesting story. In 2006, when Prime Minister Harper took office, oil and gas (including support activities) comprised 8% of taxable corporate income in Canada – a total which fell to 4.3% by 2011. Similarly, the oil and gas share of total taxes paid fell from 9.4% in 2006 to 4.2% in 2011. The story is similar in Alberta with respect to royalties – resource royalties as a share of government income were over 40% when Prime Minister Harper took office, and are around 30% today – still important, of course, but not increasing as you might have been led to believe. If the oil and gas industry is worried about paying for our schools, hospitals, and social programs, they are going to have to get their profitability house in order first—Statistics Canada estimates that sector profit margins dropped from 21.5% in 2005 to 8.5% in 2011. Taxes are paid on net revenue, after all.
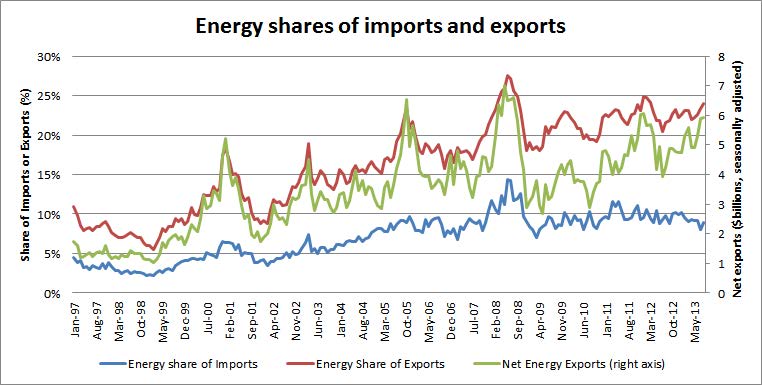
Lastly, we hear a lot about energy exports, which have definitely increased, although more in the pre-Harper years than since he took office. The figure below shows energy sector imports and exports both increasing since 1997 (this data set was truncated to match the GDP data above), with significant changes in net exports as well. In the period from 1997 through to PM Harper’s swearing-in, energy exports increased at an average rate of 10% per year—yes, 10%. Since, they’ve increased at an average rate of 5%. Net exports follow basically the same trend – an increase of 10% in the 9 years before this Prime Minister took office, and 5% per year on average since. Net exports have increased quickly since the depth of the financial crisis, in January of 2009, at a rate of 15% per year on average, but even over that period, exports grew at a rate nearly identical to the pre-Harper years. We best be careful. Another decade or two with these kind of increases and we’ll be in Norway territory.

If someone tries to tell you that Canada has bet the economy on the oil sands or that we are a petrostate, perhaps this will give you a few tools to question that contention.