The mini-recession of 2012-13
Only when you look beyond the headline employment numbers will you see the extent to which confidence in the job market plummeted
Share

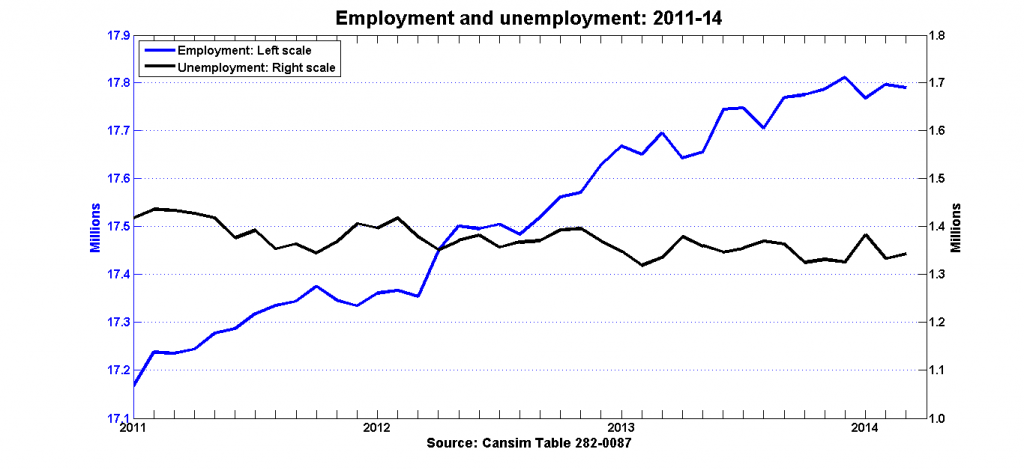
The data from the monthly Labour Force Survey releases get a lot of attention—probably more than they deserve. Although the headline numbers for employment and unemployment rates are clearly of great interest, they represent only a partial view of the labour market. Here are the headline numbers for employment and unemployment for the past few years:
The monthly changes in employment are generally positive, increasing by less than 20,000 in an average month. Unemployment has fallen, but at an even slower pace: a reduction of just over 2,000 per month out of a stock of more than 1 million. But it’s important to remember that these are net changes in employment and unemployment. The gross flows into employment (i.e., hires) and out of employment (layoffs and voluntary quits) are an order of magnitude greater than the net changes that make the headlines.
Even though unemployment has stayed above 1 million people over the last three years, the people who are unemployed now are, for the most part, not the same people who were unemployed in 2011: employment spells typically last 3 or 4 months or less. The most harmful effect of recessions isn’t that unemployment increases (although that’s clearly not a good thing), but that it’s harder to leave unemployment during recessions. As Mike Moffatt notes, the prospects for the unemployed worsen as the duration of their unemployment spells lengthen. Data on the net changes in the number of unemployed are a much less useful indicator of the strength of the job market than data on the gross flows into and out of unemployment.
Statistics Canada doesn’t publish data on labour market flows, but it is possible to extract some information from the Public Use Microdata Files (PUMF) of the Labour Force Survey. (See this earlier post for details; the approach is due to this paper by the IRPP’s Stephen Tapp.)
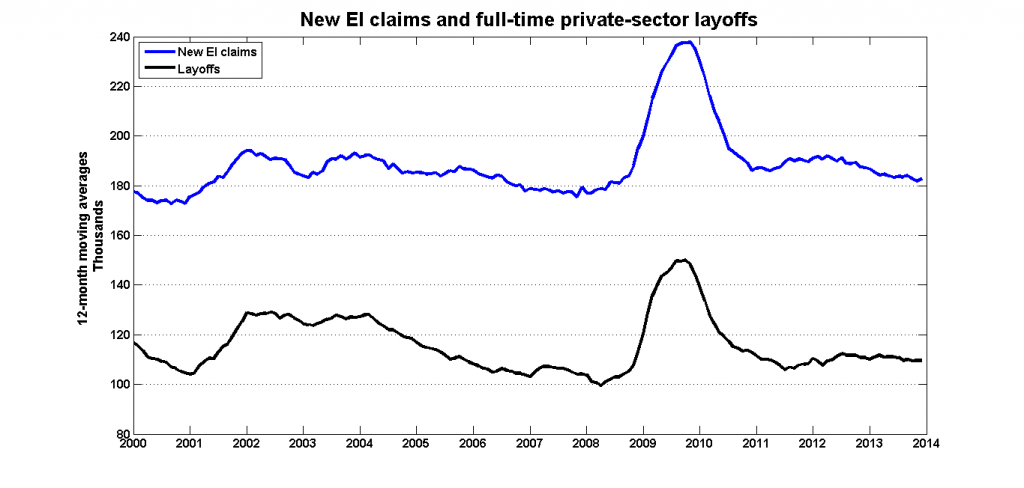
First up is transitions out of employment. I’m going to look at two indicators: new EI claims (these are claims received, not those accepted) and unemployed people who were laid off from a private-sector, full-time job in the previous month. The data are not deseasonalized, so I’m using 12-month moving averages.
These two series have almost identical properties:
Look at the vertical axis. More than 100,000 people—about 1.2 per cent of the total—lose a full-time, private-sector job each month, and almost 200,000 people submit an initial EI claim. And this is during normal times: these monthly flows increased by up to 60,000 newly-unemployed per month during the recession.
When I went though this exercise in September of 2012, I concluded that the Canadian labour market was ‘back to normal’, because the gross flows had returned to pre-recession levels. This is still true as far as layoffs and initial EI claims go. But there’s reason to believe that the labour market softened during the the latter part of 2012 and the first part of 2013, even though net changes in employment and unemployed remained steady.
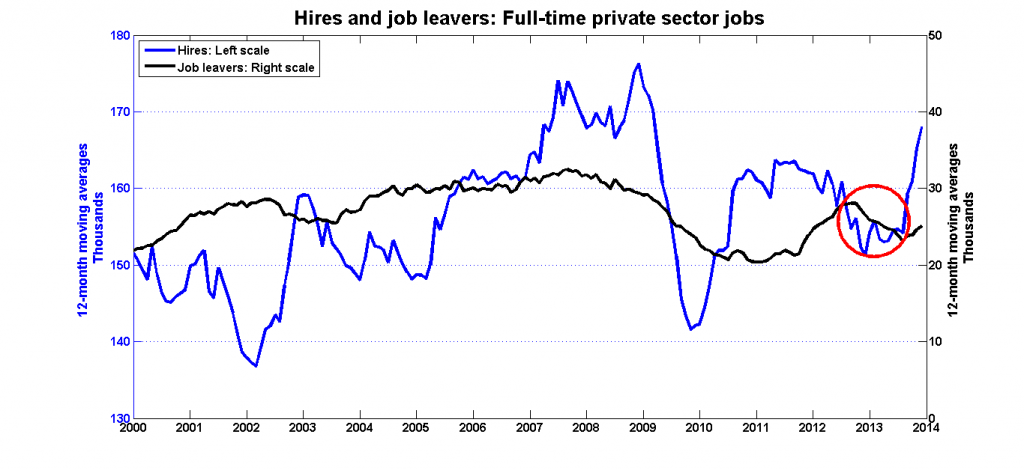
Variations in quits—that is, voluntary job separations—are not large enough to significantly affect gross labour market flows, but they are still a useful indicator of the perceived strength of the job market. Workers are less likely to leave their jobs of their own accord if they think that it will be difficult to find another. Hires are of course and even stronger indicator of labour market strength on the demand side.
Here are the data for hires and quits for private-sector full-time jobs:
Hires and quits had more or less returned to pre-recession levels by mid-2012. But it would appear that both workers and firms lost confidence in job market in the months that followed. Hires fell by 10,000 per month, but so did quits. Both developments are best viewed as a weakening of the labour market, but they canceled each other out in the headline numbers: there was no effect on the net changes in employment and unemployment. The good news is that both hires and quits rebounded in the second half of 2013, which suggests that both workers and firms have since regained some of that lost confidence.
The monthly LFS releases make headlines and move markets, but they are merely the tip of the employment iceberg. One-tenth of labour market activity is observed directly, and we have only partial glimpses of what lies beneath the surface.


