As Stephen Gordon wrote last month in Econowatch, the Bank of Canada has been wrong for at least the past four years. It’s not alone. A study released today by the Organization for Economic Cooperation and Development into its own considerable forecasting errors during the financial crisis offers a detailed glimpse into why economists have such a poor track record predicting where the economy is headed.
The OECD admits its own year-ahead forecasts for the global economy were off by an average of 2.6 percentage points between 2007 and 2009. That might seem a small error, but it actually represents a gargantuan mistake. For instance, in that range an economist could predict the Canadian economy would grow at a rate of 1.5 per cent, when it actually fell by 1.1 per cent: the difference between slow, but positive economic growth, and a recession.
Forecasting got more accurate in the aftermath of the recession, but the organization’s errors still overestimated annual growth by an average 0.3 percentage points between 2010 and 2012.
The OECD is the latest international organization to issue a post-mortem on its forecasting problems throughout the global economic downturn. The International Monetary Fund issued a rundown of its forecasting errors in 2012. But in its recent report the OECD offers up a few reasons for its poor track record — which typically expected the global economy to improve much faster than it actually did — that can help Canadians understand why our own central bank so often gets it wrong:
Among the findings:
- Historically forecasters generally ignored the state of the financial sector in their forecasts, since it wasn’t seen as having a significant impact on economic growth. That meant they largely missed both the massive growth in bank credit and the dramatic expansion of financial institutions across international borders that sparked the credit crisis.
- They assumed that European leaders would quickly move to shore up the eurozone’s most troubled banks—as the U.S. did—and that Europe’s economic crisis would slowly wind down, with government bond yields gradually converging across the region. Instead, Europe experienced almost the opposite phenomenon: political battles over how to shore up the continent’s banking sector and whether or not to bail out broke countries like Greece, sparking the sovereign debt crisis.
- They suffered from groupthink. “We all went to the same schools and we’re taught to think about economics in the same way and we’re looking at the same data,” says OECD economist Sebastian Barnes. “So it’s kind of inevitable you’re going to have that.”
The report also suggests that oft-debated austerity policies weren’t responsible for slower-than-expected economic growth outside of Europe. Even within Europe, Greece was the only country where austerity created unpredictable economic shocks. For most other countries, researchers found, the effects of government budget-cutting were easy to estimate in advance and not nearly as harmful as austerity critics suggest. “People often blame the nearest thing to hand, which is to blame fiscal policy” says Barnes. “[The research] really supports the idea that that wasn’t the issue.”
While most forecasters missed the buildup of U.S. the housing bubble, the report’s authors say they mostly got it right when it came to predicting what high house prices and a massive buildup of consumer credit would mean for a country’s economy once the financial crisis began. At the same time, they miscalculated how much countries with longstanding trade deficits would suffer in the financial downturn.
As for why economic forecasting errors are more likely to overestimate rather than underestimate growth, OECD chief economist Nigel Pain says it’s often easier to find positive signals in the economy than spot signs of an impending crisis. Economists have typically missed the biggest shocks to the economy: the oil crisis of the 1970s, the dot-com bubble and the U.S. housing collapse. Also, central bankers and political leaders are hardwired to promote themselves as stewards of the economy and therefore gravitate to signs that they’re doing a good job. “Countries are always a bit more welcoming of positive news than bad news,” he says.
Given how badly most economic forecasters performed throughout the financial crisis, economists are moving away from their old forecasting models. Those typically relied on data from industry and government, much of which is released months after the fact, only to be revised again months later. Instead, Barnes says, central banks are increasingly looking at “nowcasting”—using more real-time data and more informal sources to gauge the health of the economy.
OECD economists now spend more time talking to business and financial leaders to gather anecdotal information about the state of the financial markets. Some central banks have begun to incorporate “big-data” into their forecasts: financial data such as real-time banking and credit card transactions, updated minute-to-minute, in order to spot the early warning signs that the economy is about to take a nose dive.
“One of the problems in forecasting is just knowing where we are today before we start to think about where (we’re headed) in the future,” Barnes says. “So these kinds of things would allow us to monitor the economy more in real-time could really help us a great deal.”
Another word of advice to central bankers? Stop pretending you have all the answers. “One of the lessons of the crisis is that we have to be more humble about what we know,” he says.
The OECD studied the accuracy of its economic forecasts dating back to the 1970s. In general, it was more accurate in predicting economic growth in North America than in Europe. But even in Canada it got it wrong in 39 out of the past 42 years.
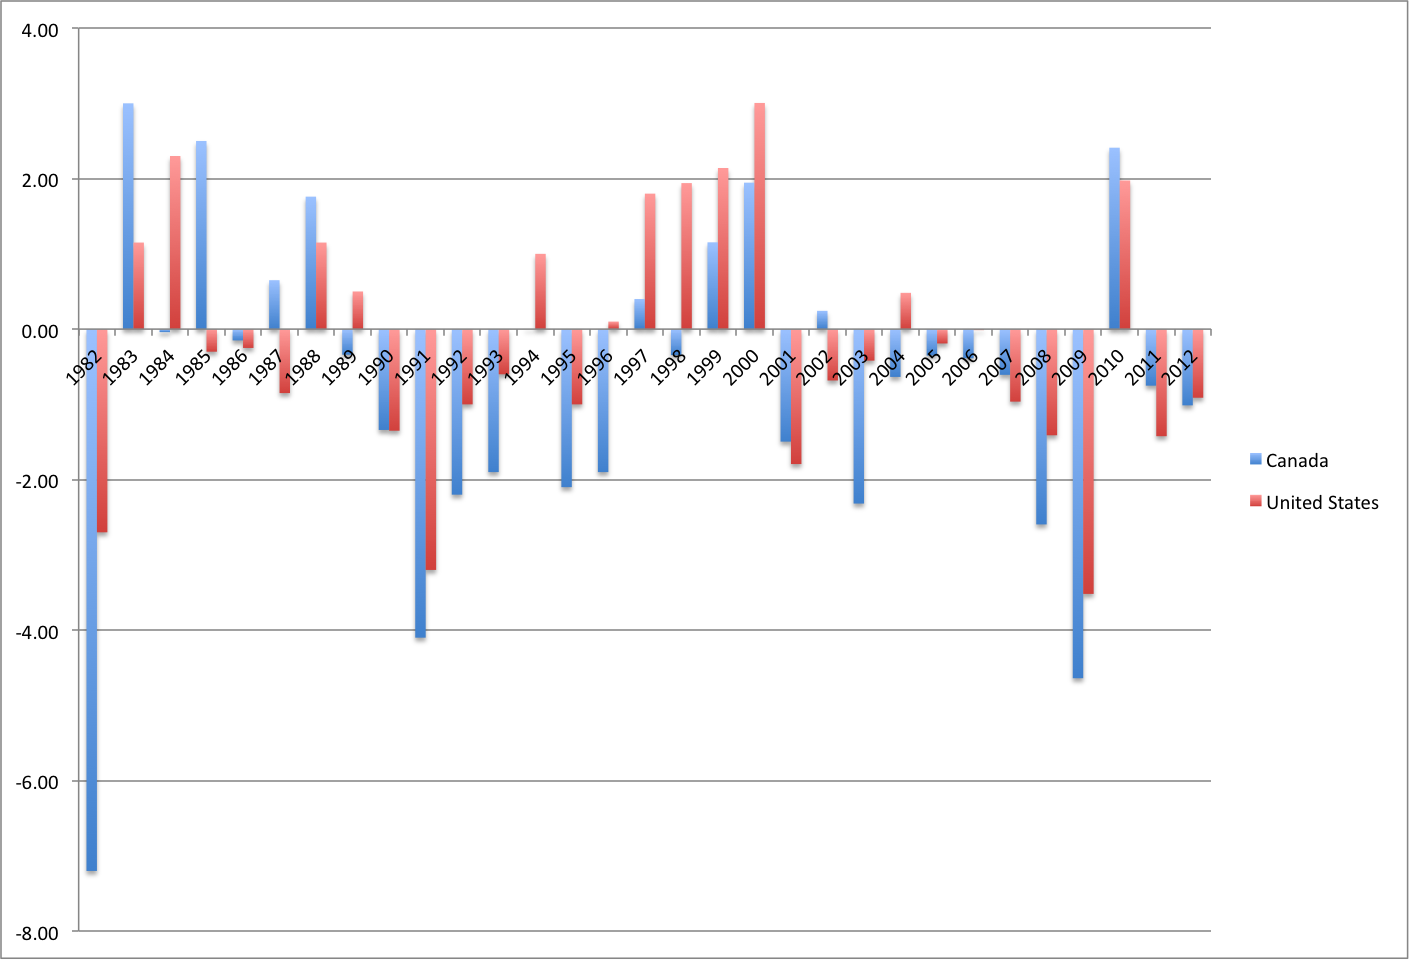
The following chart shows the magnitude of the OECD’s forecasting errors for Canada and the U.S. from 1971 to 2012. The forecasts were made in May of that year predicting how fast the economy would grow in the following year. A negative line indicates overestimated growth, while a positive line means the economy performed better than expected. The chart measures the magnitude of forecasting errors in percentage points: so a negative two per cent line means the forecasters underestimated growth by two percentage points (i.e. they predicted the economy would grow at a rate of one per cent, when it in reality it fell by one per cent.)

