Canada’s richest communities 2019
The richest place in Canada has an average household net worth of $4.5 million

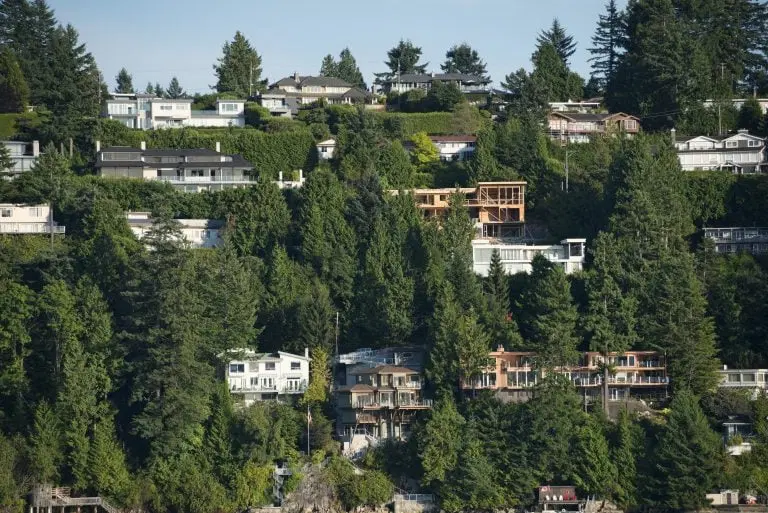
West Vancouver, British Columbia (RonTech2000/iStock)
Share
[linknav category=536894]

Watchers of Canadian real estate prices won’t be surprised the most affluent place in Canada is West Vancouver, with an average household net worth of $4.5 million. The median household income in this municipality sits at $107,000, but West Vancouver’s average housing price of $2.8 million—the highest in the country—indicates that property values are still the primary driving force behind household net worth. The city’s median household income is about $107,000 according to the latest data from Environics Analytics.
With property prices outpacing wages, net worth metrics can be deceiving. Someone making a modest income who bought a house in Canada’s most expensive cities years ago might find themself a millionaire on paper. Meanwhile, a would-be first-time buyer making the exact same income today might find themself priced out of the market.
Our figures show the housing crisis in Canada’s major cities persists, despite measures taken by various levels of government to tamp them down. Taxes on foreign buyers and tighter mortgage rules have slowed stratospheric gains in Toronto and Vancouver, but the cost of homeownership relative to median incomes is still unattainably high for many.
Westmount, Que., an affluent enclave of Montreal, finished second in our ranking of the wealthiest communities, with an average household net worth of $3.7 million. Alberta’s Rocky View County, which surrounds most of Calgary, finished third with $3.3 million. The township of King, north of Toronto, and Mont-Royal, Que., west of downtown Montreal, finished fourth and fifth, respectively.
To get an idea of the disparities between communities, Burlington, Ont., this year’s winner in the Best Communities ranking, has a median household income of $101,000 and an average household net worth of $1.1 million. That’s $3 million less than the average net worth of a person who lives in West Vancouver. The average West Vancouver household has quadruple the wealth of a Burlington household, despite bringing in a similar income.
Maclean’s Best Communities in Canada ranks 415 cities across the country based on 10 categories: Wealth and economy, affordability, population growth, taxes, commute, crime, weather, access to health care, amenities and culture. For more information, please see the methodology page. To see even more statistics about the Best Communities in Canada, see the full ranking.
Search to filter by city or province:
| Rank | City | Province | Average household net worth |
|---|---|---|---|
| 1 | West Vancouver | BC | $4,454,424 |
| 2 | Westmount | QC | $3,653,100 |
| 3 | Rocky View County | AB | $3,336,048 |
| 4 | King | ON | $2,792,290 |
| 5 | Mont-Royal | QC | $2,588,821 |
| 6 | Whitchurch-Stouffville | ON | $2,410,521 |
| 7 | Oak Bay | BC | $2,314,752 |
| 8 | Foothills No. 31 | AB | $2,301,251 |
| 9 | North Saanich | BC | $2,028,871 |
| 10 | North Vancouver | BC | $1,996,489 |
| 11 | Greater Vancouver | BC | $1,778,235 |
| 12 | Vaughan | ON | $1,767,338 |
| 13 | Beaconsfield | QC | $1,745,755 |
| 14 | Oakville | ON | $1,737,882 |
| 15 | Markham | ON | $1,594,766 |
| 16 | Aurora | ON | $1,580,178 |
| 17 | Whistler | BC | $1,558,966 |
| 18 | Richmond Hill | ON | $1,486,850 |
| 19 | Canmore | AB | $1,446,699 |
| 20 | Uxbridge | ON | $1,431,766 |
| 21 | Langley | BC | $1,405,439 |
| 22 | Caledon | ON | $1,404,222 |
| 23 | Guelph | ON | $1,349,216 |
| 24 | Adjala-Tosorontio | ON | $1,330,956 |
| 25 | Halton Hills | ON | $1,300,762 |
| 26 | Woolwich | ON | $1,300,121 |
| 27 | Salt Spring Island | BC | $1,274,810 |
| 28 | Richmond | BC | $1,271,200 |
| 29 | Delta | BC | $1,263,460 |
| 30 | Erin | ON | $1,259,442 |
| 31 | Niagara-on-the-Lake | ON | $1,255,495 |
| 32 | Kirkland | QC | $1,245,639 |
| 33 | Coldstream | BC | $1,238,512 |
| 34 | Vancouver | BC | $1,220,613 |
| 35 | East Gwillimbury | ON | $1,209,158 |
| 36 | Leduc County | AB | $1,193,992 |
| 37 | Port Moody | BC | $1,193,348 |
| 38 | Milton | ON | $1,188,971 |
| 39 | Côte-Saint-Luc | QC | $1,182,805 |
| 40 | White Rock | BC | $1,179,025 |
| 41 | Central Saanich | BC | $1,176,930 |
| 42 | Pelham | ON | $1,171,714 |
| 43 | Springwater | ON | $1,164,633 |
| 44 | Sturgeon County | AB | $1,124,982 |
| 45 | Middlesex Centre | ON | $1,109,584 |
| 46 | Burlington | ON | $1,099,461 |
| 47 | Coquitlam | BC | $1,095,819 |
| 48 | Strathcona County | AB | $1,082,581 |
| 49 | Surrey | BC | $1,079,951 |
| 50 | Red Deer County | AB | $1,075,721 |
| 51 | Saanich | BC | $1,069,875 |
| 52 | Oro-Medonte | ON | $1,068,261 |
| 53 | Chestermere | AB | $1,039,118 |
| 54 | Parkland County | AB | $1,018,335 |
| 55 | West Kelowna | BC | $1,016,369 |
| 56 | Sidney | BC | $1,008,780 |
| 57 | Burnaby | BC | $1,002,938 |
| 58 | Scugog | ON | $1,002,422 |
| 59 | Rosemère | QC | $1,002,384 |
| 60 | Rothesay | NB | $999,754 |
| 61 | Cochrane | AB | $989,918 |
| 62 | Wellesley | ON | $981,400 |
| 63 | Lincoln | ON | $975,321 |
| 64 | Lake Country | BC | $972,810 |
| 65 | Okotoks | AB | $962,486 |
| 66 | Newmarket | ON | $956,210 |
| 67 | Maple Ridge | BC | $955,690 |
| 68 | Pickering | ON | $946,052 |
| 69 | Lacombe County | AB | $943,696 |
| 70 | Toronto | ON | $941,973 |
| 71 | Pitt Meadows | BC | $941,009 |
| 72 | Grande Prairie County No. 1 | AB | $927,899 |
| 73 | Saint-Lambert | QC | $915,793 |
| 74 | Saint-Bruno-de-Montarville | QC | $912,912 |
| 75 | Waterloo | ON | $910,103 |
| 76 | Brampton | ON | $904,562 |
| 77 | Brant | ON | $902,709 |
| 78 | Wilmot | ON | $902,570 |
| 79 | Smith-Ennismore-Lakefield | ON | $898,737 |
| 80 | St. Andrews | MB | $895,566 |
| 81 | Saint-Augustin-de-Desmaures | QC | $890,027 |
| 82 | Kelowna | BC | $887,998 |
| 83 | Boucherville | QC | $887,289 |
| 84 | Mont-Saint-Hilaire | QC | $886,221 |
| 85 | Grimsby | ON | $880,615 |
| 86 | Weyburn | SK | $880,193 |
| 87 | Ajax | ON | $877,112 |
| 88 | Mississauga | ON | $867,992 |
| 89 | West Lincoln | ON | $866,767 |
| 90 | North Vancouver | BC | $862,344 |
| 91 | Thames Centre | ON | $861,106 |
| 92 | Hamilton | ON | $857,014 |
| 93 | Saugeen Shores | ON | $853,394 |
| 94 | Whitby | ON | $853,148 |
| 95 | Mapleton | ON | $850,786 |
| 96 | Port Coquitlam | BC | $850,383 |
| 97 | Lloydminster | AB | $848,282 |
| 98 | Bradford West Gwillimbury | ON | $847,902 |
| 99 | New Tecumseth | ON | $845,233 |
| 100 | Georgian Bluffs | ON | $844,667 |