The latest 338Canada projection: So long, Tory lead
Philippe J. Fournier: This week’s projection shows no favourite, but the trend is clear: the Conservatives’ advantage has faded into the distance

Scheer is greeted by a mascot while visiting an agricultural fair in St-Hyacinthe, Que. on July 23, 2019 (THE CANADIAN PRESS/Paul Chiasson)
Share
Polling firms across Canada were once again busy last week measuring the mood of Canadians towards the up-coming general federal election. Here is a short recap of these new pieces of data:
- The Vancouver-based firm Research Co. released its first federal horse race poll of the year, and has the Liberal Party at 34 per cent nationally—ahead by a thin 3-point margin over the Conservatives. According to Research Co., the Liberals are leading in the Atlantic provinces and Quebec. The Conservatives remain in first place in the Prairies and Alberta. Both parties are statistically tied in Ontario and B.C. You can find Research Co.’s report here.
- Abacus Data also published its latest findings and has a tie for the Liberals and Conservatives at 32 per cent apiece. Abacus also presented results of Canadians’ impressions of federal leaders and of some provincial premiers (such as Ford, Legault, and Kenney). Additionally, Abacus polled Canadian on their impressions of American President Donald Trump. Here’s Abacus Data’s full report.
- On Friday, a new poll from Léger/The Canadian Press also showed the race tightening between the two main parties. Although Léger still has the CPC ahead nationally 36 to 33, the CPC lead over the Liberals went from 9 points in early June to only 3 points in July. This change in voting intentions is most due to the Ontario numbers: in June, Léger had measured a 10-point lead for the Conservatives in the province; the latest poll has the parties tied at 36 per cent apiece. Also of note: Léger measures the NDP at only 11 per cent nationally, one point below the Greens. Here is Léger’s report.
- Finally, we add to the model a Mainstreet/iPolitics riding poll of Whitby, a swing district located in the 905 region of Ontario, which has the Conservatives at 41 per cent of decided voters, and the Liberals at 40 per cent. Considering the poll’s margin of error of ±4 per cent, this result should be considered a statistical tie.
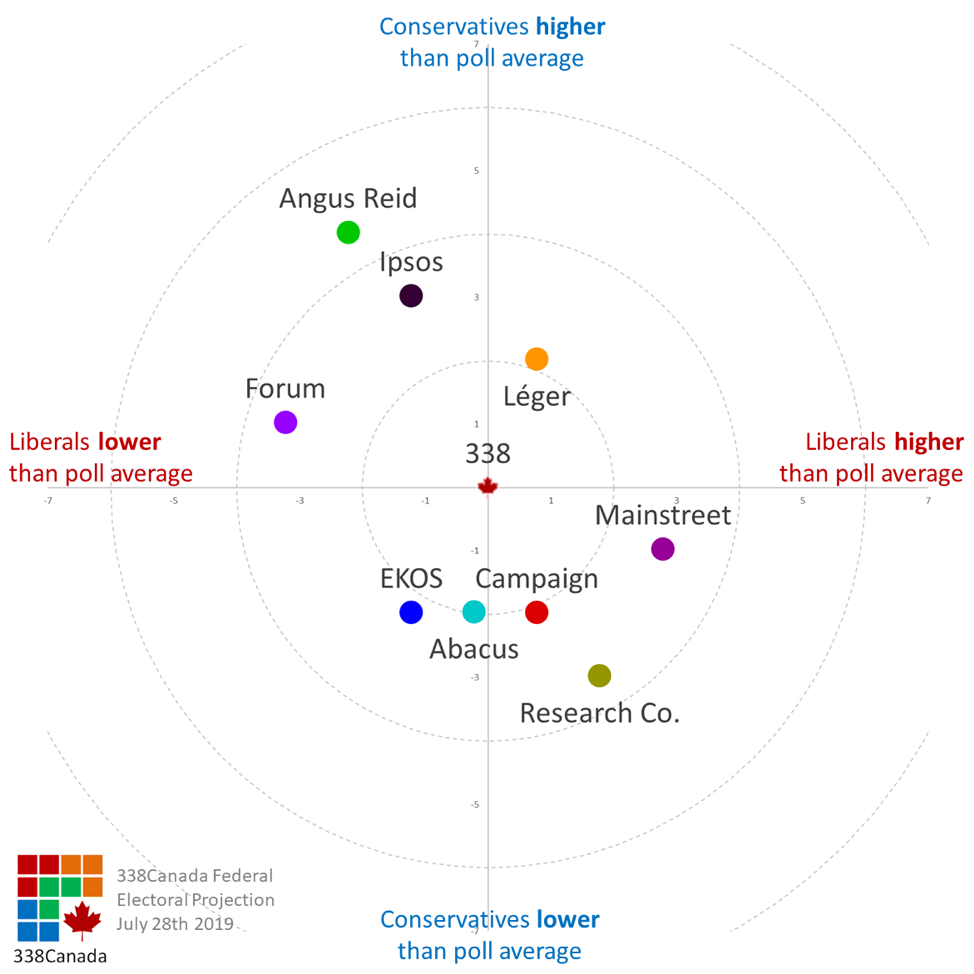
Here are the publicly available federal polls published in July compared to the 338Canada’s weighted poll averages for the Liberals and Conservatives:
Since the vote projection is so close, just a few points separating the LPC and CPC could make a world of difference in the outcome of the election. The fact that numbers differ so much from one poll to another indicates that public opinion is very much in flux and that there’s a high level of uncertainty.
Nevertheless, we should note that every dot on the graph above is located within a 5-point radius of the 338Canada’s weighted average.
Popular Vote Projection
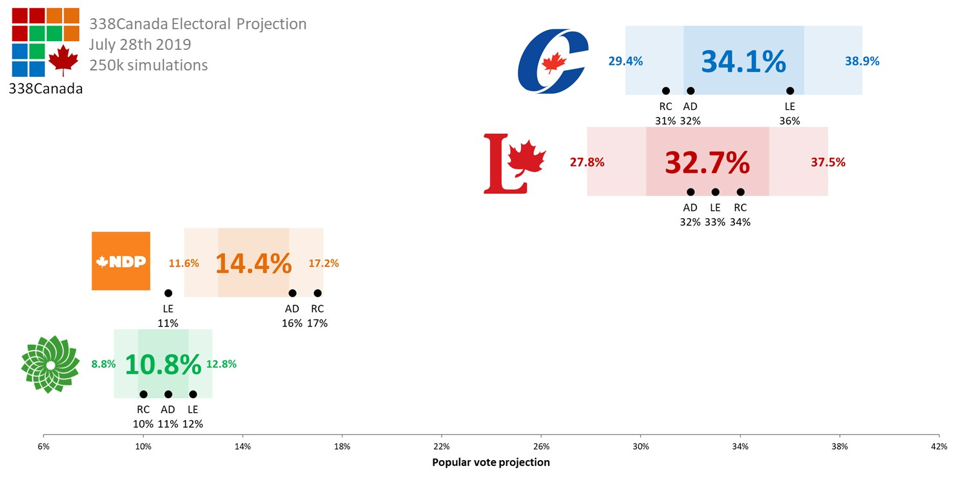
The Conservatives are still holding a narrow lead in the popular vote projection with a national average of 34.1 per cent. However, as we will see below, the concentration of Conservative support in Alberta and the Prairies makes the CPC vote significantly less efficient in our first-past-the-post system. (For instance, it probably would not matter much whether 55 per cent or 65 per cent of Albertans supported Andrew Scheer and his team, because it wouldn’t win them any more seats).
While the recent gains in Quebec are certainly a plus for the Conservatives, they will have to find a way to win more Ontario and Atlantic districts to secure a plurality of seats at the House of Commons.
[On the graph above: The coloured bars are the 338Canada’s popular vote confidence intervals. The black dots indicate the latest poll results. LE: Léger; AD: Abacus Data; RC: Research Co.]
The Liberals currently stand at an average of 32.7 per cent, and have modestly increased their standings in Atlantic Canada, Quebec and British Columbia.
The NDP’s numbers show once again the widest variance from one pollster to another. Research Co. has the NDP as high as 17 per cent, while Léger measures its support at only 11 per cent, just below the Greens.
Seat Projection
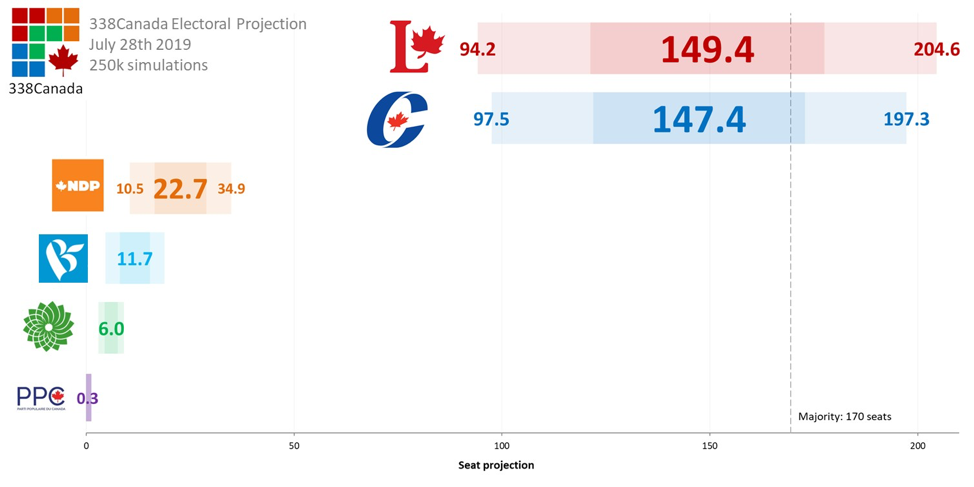
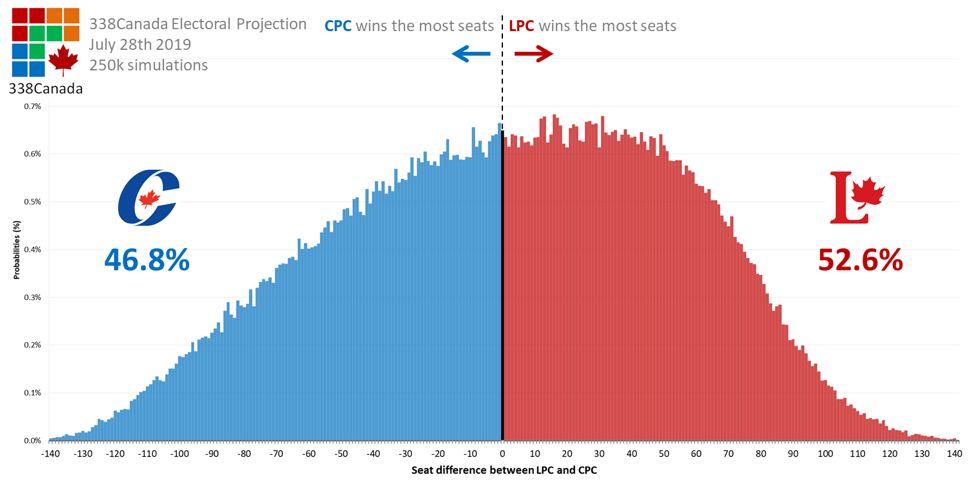
Once again this week the seat projection is a dead-heat between the Liberals and Conservatives. Since so many districts in Quebec, Ontario and B.C. are currently projected as toss-ups, the seat projection confidence intervals remain unusually wide (indicating a high level of uncertainty). The Liberal seat average this week stands at 149 seats, while the Conservative’s average is 147 seats—a gap between the two parties that is much inferior to the projection’s uncertainty.
If these numbers were to hold until election day, the model’s final projection would simply be too close to call—which would be a major contrast with the latest elections I have covered in Ontario, Quebec and Alberta, where a clear favourite had been identified by the model (Ford’s PC, Legault’s CAQ, and Kenney’s UCP).
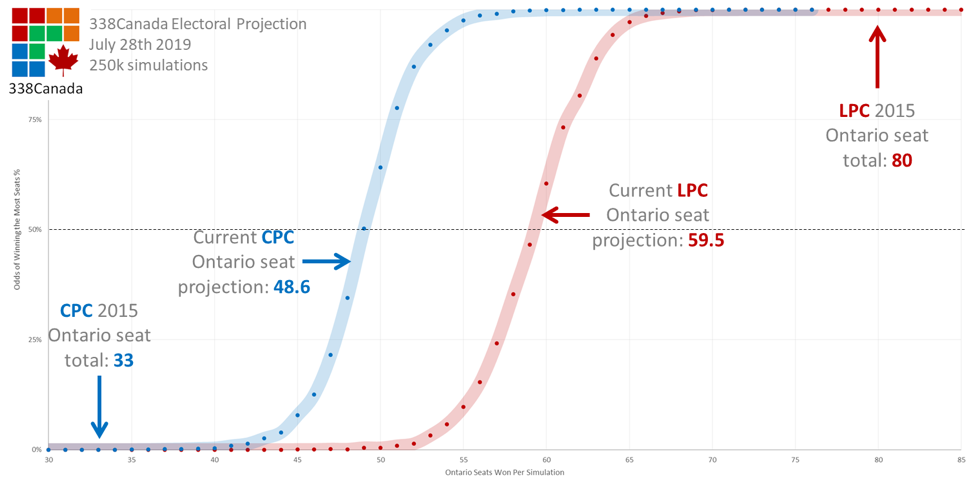
By comparing the current numbers with the 2015 election results, we notice there is a major seat shift in the province of Ontario. The graph below indicates the odds of winning the most seats nationally versus the numbers of Ontario seats won per simulation:
Hypothetically, according to current numbers, should the Liberals fall to or below 50 Ontario seats (a net loss of at least 30 seats compared to 2015), it would be virtually and mathematically impossible for the Liberals to win the most seats in Canada. In this scenario, the only way Justin Trudeau could remain Prime Minister would be to forge alliances with the NDP and the Greens (and the Bloc?) to win the confidence of the House.
Conversely, the Conservatives simply cannot expect to win the most seats in Canada if they do not make significant gains in Ontario. In 2015, the CPC won 33 Ontario districts—a sharp 40 seat drop from the Harper majority victory of 2011. According to the model’s data, a net gain of 20 Ontario seats for the CPC (for a hypothetical total of 53) could barely be enough to secure a Conservative plurality—that is if the Conservative Party manages to keep its current numbers in Quebec and Atlantic provinces.
Odds of Winning the Most Seats
Over the course of 250,000 general election simulations, the 338Canada model finds the Liberal Party winning the most seats in just below 53 per cent of simulations. However, considering the massive uncertainty in the data, we should consider these odds as nothing but a coinflip. The gap between the two main parties is simply not wide enough to consider any of them a favourite.
Nevertheless, even though there is no definite favorite as of this writing, the trend of the last few weeks is remarkably clear: The Conservatives have let their winter/spring lead fade into the distance and it appears the SNC-Lavalin story may have run its course.
Additionally, Scheer’s release of this party’s environmental platform did little to move the needle, and it remains unclear whether it convinced potential Green voters to join the Conservative fold.
Will the CPC choose to go headfirst into this campaign running against the “Trudeau brand”? It would appear to be a risky bet: although the Prime Minister surely has detractors across the country, Abacus Data’s latest poll shows Trudeau leading Scheer by five points on who would be the preferred Prime Minister—even though Abacus has both parties polling at 32 per cent.
Therefore, according to these figures, Andrew Scheer may not pull his party down, but neither does he push his party upwards – unlike Trudeau with the LPC.
The tracking continues. Only 85 days until election day.
