Where to find the best weather in Canada 2019
Two provinces dominated this ranking of best communities for weather in Canada

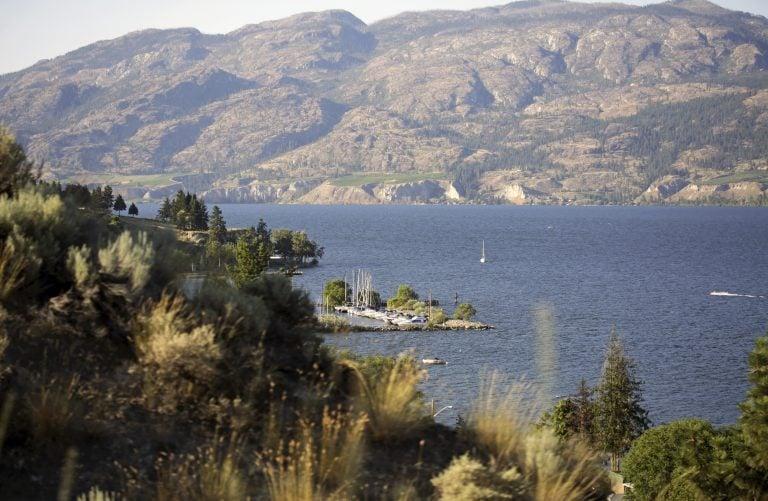
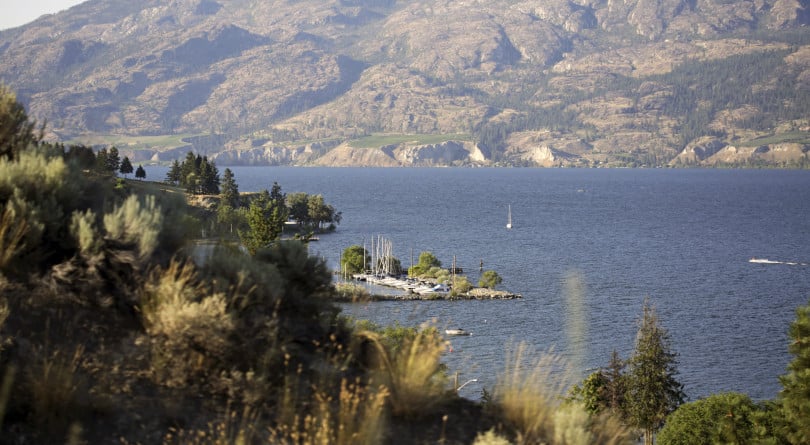
Summerland, British Columbia (Kathryn Hatashita Lee/iStock)
Share
[linknav category=536894]

There’s nothing Canadians love more than talking about the weather and when they’re choosing a place to live, minimizing the number of days they’ll spend shovelling snow can be an important factor.
For the most desirable weather, no province in the country comes close to B.C.
Summerland and Penticton, the two communities southwest of Kelowna in the Okanagan Valley, topped our list this year for best weather. They’re virtually tied for warm summers and mild winters, with community averaging about 129 days above 20°C, and 255 days above 0°C.
Canada’s second-warmest province is Ontario, where Kingsville, Leamington and Chatham-Kent—three communities in the Windsor-Essex region, the southernmost point in Canada—stand out as having consistently more temperate climates than the rest. Toronto, which isn’t particularly known for its great weather, has milder winters compared to the rest of Canada than you might realize, with 264 days per year above 0°C.
Mild winters are the most important factor in our ranking of the cities with the best weather, with seven out of 10 points in the category dedicated to the number of days above 0°C. We also reward communities with dry climates, with two points dedicated to the number of days per year without rain or snow. Finally, we considered warm summers, giving one point for lots of days above 20°C.
READ: Why supercharged small towns are better than big cities
Mont-Saint-Hilaire, Que., is the only city outside of B.C. and Ontario to break into the top 50 of the best communities for weather. The off-island suburb, just east of Montreal, enjoys 287 days above zero degrees and has 154 days of rain or snow a year.
Maclean’s Best Communities in Canada ranks 415 cities across the country based on 10 categories: Wealth and economy, affordability, population growth, taxes, commute, crime, weather, access to health care, amenities and culture. For more information, please see the methodology page.
Search to filter by city or province:
| City name | Province | Rank | Days per year with rain or snow | Days per year above 0C | Days per year above 20C |
|---|---|---|---|---|---|
| Summerland | BC | 1 | 119.2 | 254.6 | 129 |
| Penticton | BC | 2 | 119.22 | 254.6 | 128.98 |
| Kamloops | BC | 3 | 105.58 | 246 | 131.99 |
| West Kelowna | BC | 4 | 119.9 | 246.4 | 123.8 |
| Lake Country | BC | 5 | 131.4 | 268 | 115.4 |
| Kingsville | ON | 6 | 129.3 | 246.1 | 123.7 |
| Leamington | ON | 7 | 129.33 | 246.1 | 123.67 |
| Chatham-Kent | ON | 8 | 137.07 | 246.9 | 132.09 |
| Toronto | ON | 9 | 145.49 | 264.4 | 117.23 |
| Essex | ON | 10 | 133.5 | 243.3 | 137.6 |
| Amherstburg | ON | 11 | 133.5 | 243.3 | 137.6 |
| LaSalle | ON | 12 | 149.5 | 248.9 | 138.9 |
| Lakeshore | ON | 13 | 149.5 | 248.9 | 138.9 |
| Tecumseh | ON | 14 | 149.5 | 248.9 | 138.9 |
| Windsor | ON | 15 | 149.54 | 248.9 | 138.85 |
| Thorold | ON | 16 | 119.7 | 239.7 | 115.3 |
| Colwood | BC | 17 | 148.6 | 346.6 | 56.9 |
| Langford | BC | 18 | 148.6 | 346.6 | 56.9 |
| Esquimalt | BC | 19 | 148.6 | 346.6 | 56.9 |
| Vernon | BC | 20 | 135.78 | 249 | 107.54 |
| Burlington | ON | 21 | 135.77 | 239 | 125.32 |
| Mont-Saint-Hilaire | QC | 22 | 154.7 | 287.8 | 117 |
| Pelham | ON | 23 | 128.2 | 239.7 | 115.3 |
| St. Clair | ON | 24 | 137.6 | 233.9 | 129 |
| Delta | BC | 25 | 155 | 343.8 | 64.28 |
| Mississauga | ON | 26 | 126.19 | 242.4 | 102.78 |
| North Cowichan | BC | 27 | 154.2 | 285.2 | 104.7 |
| White Rock | BC | 28 | 157.4 | 343.8 | 64.3 |
| Sooke | BC | 29 | 158.6 | 346.6 | 56.9 |
| Port Colborne | ON | 30 | 153.2 | 244.6 | 116.6 |
| Victoria | BC | 31 | 155.05 | 319.2 | 78.88 |
| Haldimand County | ON | 32 | 153.23 | 244.6 | 116.56 |
| Sidney | BC | 33 | 155.1 | 319.2 | 78.9 |
| St. Catharines | ON | 34 | 150.68 | 238.1 | 127.47 |
| Niagara-on-the-Lake | ON | 35 | 150.7 | 238.1 | 127.5 |
| North Saanich | BC | 36 | 158.5 | 334 | 70.5 |
| Central Saanich | BC | 37 | 158.5 | 334 | 70.5 |
| Saanich | BC | 38 | 158.51 | 334 | 70.54 |
| Brampton | ON | 39 | 145.94 | 228.7 | 122.26 |
| Sarnia | ON | 40 | 149.98 | 232.5 | 120.81 |
| Nelson | BC | 41 | 162.53 | 262.4 | 115.19 |
| Belleville | ON | 42 | 148.62 | 229.3 | 117.15 |
| Grimsby | ON | 43 | 162.8 | 244.2 | 121.4 |
| Lincoln | ON | 44 | 162.8 | 244.2 | 121.4 |
| West Lincoln | ON | 45 | 162.8 | 244.2 | 121.4 |
| Fort Erie | ON | 46 | 152.3 | 229.7 | 119.6 |
| Whitby | ON | 47 | 145.68 | 239 | 100.48 |
| Ajax | ON | 48 | 145.68 | 239 | 100.48 |
| Pickering | ON | 49 | 145.68 | 239 | 100.48 |
| Oshawa | ON | 50 | 145.68 | 239 | 100.48 |
| Lambton Shores | ON | 51 | 153.9 | 228.6 | 122.1 |
| Strathroy-Caradoc | ON | 52 | 152 | 226.7 | 123.3 |
| Loyalist | ON | 53 | 147.2 | 238.6 | 103.2 |
| Welland | ON | 54 | 151.77 | 226.5 | 125.67 |
| Oakville | ON | 55 | 117.55 | 221.7 | 107.18 |
| Port Hope | ON | 56 | 138.58 | 235.4 | 94.51 |
| St. Thomas | ON | 57 | 159 | 229.8 | 127.6 |
| Central Elgin | ON | 58 | 159 | 229.8 | 127.6 |
| Uxbridge | ON | 59 | 143.1 | 220.8 | 118.74 |
| Coldstream | BC | 60 | 140.5 | 220.4 | 121.9 |
| Brant | ON | 61 | 135.6 | 218.2 | 124.6 |
| Brantford | ON | 62 | 135.6 | 218.2 | 124.55 |
| Cornwall | ON | 63 | 150.11 | 224.1 | 119.94 |
| Cobourg | ON | 64 | 123.57 | 224.2 | 96.36 |
| Brighton | ON | 65 | 123.57 | 224.2 | 96.36 |
| Hamilton (Township) | ON | 66 | 123.6 | 224.2 | 96.4 |
| West Vancouver | BC | 67 | 168.94 | 324.4 | 76.5 |
| Hamilton (City) | ON | 68 | 156.23 | 226.8 | 120.19 |
| Chilliwack | BC | 69 | 189.87 | 313.7 | 109.76 |
| Middlesex Centre | ON | 70 | 156.6 | 226.2 | 124.9 |
| Prince Edward County | ON | 71 | 153.4 | 223.8 | 118.9 |
| Langley (District Municipality) | BC | 72 | 194.47 | 311.6 | 109 |
| Langley (City) | BC | 73 | 194.47 | 311.6 | 109 |
| Abbotsford | BC | 74 | 179.45 | 312.3 | 100.3 |
| South Huron | ON | 75 | 153.4 | 224.9 | 116.3 |
| Burnaby | BC | 76 | 178.27 | 326.3 | 82.54 |
| Vancouver | BC | 77 | 171.12 | 330.5 | 53.08 |
| Niagara Falls | ON | 78 | 170.66 | 240.8 | 124.49 |
| Comox | BC | 79 | 172.56 | 316.4 | 76.21 |
| Courtenay | BC | 80 | 172.56 | 316.4 | 76.21 |
| Surrey | BC | 81 | 178.02 | 315.8 | 89.04 |
| Nanaimo | BC | 82 | 175.64 | 293.7 | 96.89 |
| Powell River | BC | 83 | 179.13 | 322.8 | 77.82 |
| Brockville | ON | 84 | 154.9 | 226.6 | 111.03 |
| Elizabethtown-Kitley | ON | 85 | 154.9 | 226.6 | 111 |
| Richmond | BC | 86 | 183.84 | 305.3 | 99.52 |
| Squamish | BC | 87 | 178.4 | 299 | 93.1 |
| Mission | BC | 88 | 186.5 | 325.1 | 81.2 |
| Port Moody | BC | 89 | 170.41 | 304.3 | 72.48 |
| Clarington | ON | 90 | 146.36 | 219.4 | 110.56 |
| Norwich | ON | 91 | 148.3 | 217 | 211.5 |
| Rideau Lakes | ON | 92 | 150.1 | 218.4 | 115.9 |
| Kelowna | BC | 93 | 136.64 | 215 | 123.46 |
| Oak Bay | BC | 94 | 175.6 | 293.2 | 86.2 |
| Maple Ridge | BC | 95 | 188.1 | 297.5 | 94.4 |
| Tillsonburg | ON | 96 | 148.26 | 217 | 121.98 |
| Norfolk County | ON | 97 | 148.26 | 217 | 121.98 |
| Port Alberni | BC | 98 | 190.8 | 276.9 | 105.9 |
| New Westminster | BC | 99 | 183.1 | 320.3 | 57.03 |
| Pitt Meadows | BC | 100 | 184 | 296.1 | 92 |