infographic
Why we should all be tree-huggers
Infographic: More trees on your block could improve your health as much as a $20,000 increase in income
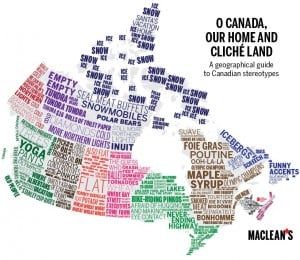
22 maps of Canada as you’ve never seen it before
Presenting a whole new way of looking at Canada and its people
Mapped: Canadian cities that swear the most on Twitter
In which city does the F-word appear most frequently? (Toronto is rather profane)
Canada ranks last in marine protection
Infographic: How does the country compare when it comes to marine protected areas?
Sweet surprises: How much sugar is in your favourite foods?
The sugar content of ice cream might not surprise you, but what about cereal—or vitamin water?
Infographic: How much sugar do you eat in a year?
The average teen boy eats 138 pounds per year, and the primary source is soft drinks
University: First year by the numbers
Crunching the numbers on the typical first-year student
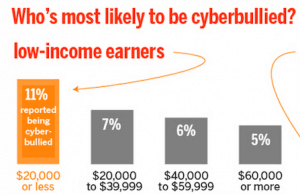
Cyberbullying and its victims
Online tormentors don’t discriminate by age. Amanda Shendruk breaks down the numbers
Canada’s rank among solar powers
Infographic: How this country stacks up to the world leaders in solar power production
How much do Canadians love Florida?
An infographic on our national infatuation with the Sunshine State
The cost of loving
Can you put a price on romance? Apparently, yes
Infographic: Where are all the jobs?
Amanda Shendruk looks at 10-year projections and points to some clues


