
Best communities in Canada for families 2019
[linknav category=536894]
When Jonathan Wadham was searching for a place to raise his family, a city with excellent public schools and well-paying jobs topped his list. Burlington, Ont., a city of about 260,000 west of Toronto, offered all that plus a strong sense of community.
"It’s literally a full-time job to find a desirable place that makes sense to raise your family," says Wadham, who moved to Burlington three years agofrom Toronto. "I went to school in Toronto and loved the city, but we couldn’t imagine raising our kids here and providing them with what we were used to when my wife and I were growing up. The cost of living is not manageable with my income."
Less than an hour’s drive from Toronto in the right traffic conditions, Burlington has a vibrant economy, and residents have the option of commuting to the Hamilton-Niagara region as well. And the unemployment rate sits at 4.7 per cent, which is relatively low. However, there are some downsides.
For instance, the average housing price of $888,000 is still higher than most communities nationwide, but it’s about $75,000 cheaper than Toronto’s $963,000. And child care isn’t cheap, with infant day care spots going for about $1,500 a month.
Related Posts

Canada is Funding its Own Economic Decline

Venezuela Can’t Deliver the Oil America Needs. Canada Can.
MORE: See the full ranking of the best communities in Canada
Affordability was Burlington’s worst category, but it made up for it by scoring in the top 25 per cent in six out of 10 categories: wealth and economy, amenities, weather, crime, health, and culture and community. Our Best Communities for Families ranking also beefs up the importance of community safety, and the Halton region has the 13th lowest crime severity index in the country.
In fact, Burlington is also the winning city in this year’s overall Best Communities in Canada ranking. And it’s attracting young families with kids—47 per cent of families in the municipality have children, and 17 per cent of the population is under the age of 15.
"When you’re a parent, you always want your kids to find playmates," Wadham says. "Obviously, it also helps us to socialize with new families with similar priorities, similar goals, and similar challenges. Burlington has been perfect in that respect."
Canada’s best communities to raise kids by region
Atlantic Canada: Rothesay, N.B. (no. 67)
Quebec: Blainville (no. 4)
Ontario: Burlington (no. 1)
Prairies: Hanover, Man. (no. 73)
Alberta: St. Albert (no. 13)
B.C.: Oak Bay (no. 43)
Search to filter by city or province:
| Rank | City name | Province | Percentage of population under age 15 | Percentage of families with children | Median monthly infant daycare fees in closest major city/region | Median monthly toddler daycare fees in closest major city/region | Percentage of population employed in arts and recreation | Community index (higher is better) | Percentage of population that walks to work | Percentage of population that bikes to work | Percentage of population that takes transit to work | Days per year with rain or snow | Days per year above 0C | Days per year above 20C | Population | Five-year population change | March 2019 economic region unemployment rate | Median household income | Average household discretionary income | Average household net worth | Average value of primary real estate | Home price to income ratio |
|---|---|---|---|---|---|---|---|---|---|---|---|---|---|---|---|---|---|---|---|---|---|---|
| 1 | Burlington | ON | 17% | 47% | 1497 | 1156 | 2.3% | 111 | 1.9% | 0.5% | 5.0% | 136 | 239 | 125 | 197381 | 5.40% | 4.7% | $101,448 | $63,511 | $1,099,461 | $887,657 | 7.08 |
| 2 | LaSalle | ON | 18% | 52% | 998 | 868 | 1.2% | 108 | 0.8% | 0.2% | 0.5% | 150 | 249 | 139 | 31868 | 6.00% | 6.5% | $109,208 | $61,822 | $783,274 | $407,888 | 3.52 |
| 3 | Oakville | ON | 18% | 56% | 1370 | 1130 | 2.5% | 111 | 1.8% | 0.4% | 8.6% | 118 | 222 | 107 | 210350 | 7.30% | 6.4% | $122,584 | $78,388 | $1,737,882 | $1,243,760 | 7.49 |
| 4 | Blainville | QC | 19% | 52% | 175 | 175 | 1.6% | 59 | 0.9% | 0.4% | 4.9% | 167 | 199 | 112 | 60530 | 7.40% | 4.7% | $95,907 | $55,086 | $642,113 | $434,311 | 3.87 |
| 5 | Milton | ON | 25% | 60% | 1370 | 1130 | 1.7% | 104 | 1.3% | 0.3% | 5.2% | 139 | 196 | 120 | 132508 | 27.80% | 6.4% | $114,275 | $60,734 | $1,188,971 | $1,229,291 | 9.42 |
| 6 | Russell | ON | 20% | 51% | 955 | 1009 | 1.6% | 98 | 1.9% | 0.2% | 2.4% | 164 | 210 | 78 | 17391 | 6.70% | 5.1% | $115,792 | $67,301 | $552,088 | $419,917 | 3.21 |
| 7 | Vaudreuil-Dorion | QC | 23% | 49% | 175 | 175 | 2.0% | 77 | 1.9% | 0.5% | 4.0% | 159 | 199 | 111 | 41486 | 13.10% | 5.3% | $83,631 | $43,630 | $437,536 | $411,735 | 4.58 |
| 8 | Deux-Montagnes | QC | 17% | 45% | 175 | 175 | 2.6% | 59 | 2.1% | 0.8% | 16.2% | 169 | 219 | 107 | 18049 | 0.90% | 4.7% | $76,065 | $42,762 | $286,152 | $285,786 | 3.35 |
| 9 | Aurora | ON | 18% | 57% | 1370 | 1130 | 2.0% | 109 | 1.8% | 0.2% | 5.8% | 165 | 221 | 119 | 60042 | 6.30% | 6.4% | $115,191 | $69,007 | $1,580,178 | $1,192,155 | 8.1 |
| 10 | Ottawa | ON | 18% | 45% | 955 | 1009 | 2.6% | 108 | 4.6% | 1.6% | 12.3% | 161 | 216 | 117 | 1019693 | 7.60% | 5.1% | $92,579 | $56,501 | $721,100 | $543,814 | 4.75 |
| 11 | Brant | ON | 18% | 46% | 1497 | 1156 | 1.3% | 119 | 1.5% | 0.2% | 0.6% | 136 | 218 | 125 | 39263 | 4.90% | 4.7% | $97,437 | $55,360 | $902,709 | $572,728 | 5.59 |
| 12 | Grimsby | ON | 18% | 45% | 1497 | 1156 | 1.6% | 114 | 1.6% | 0.3% | 0.9% | 163 | 244 | 121 | 28631 | 6.80% | 4.7% | $98,669 | $60,242 | $880,615 | $682,614 | 5.95 |
| 13 | St. Albert | AB | 19% | 48% | 975 | 870 | 2.0% | 103 | 1.8% | 0.4% | 2.8% | 113 | 177 | 84 | 70213 | 4.00% | 7.3% | $123,659 | $81,042 | $843,729 | $426,257 | 2.91 |
| 14 | Saint-Constant | QC | 19% | 50% | 175 | 175 | 1.6% | 57 | 1.6% | 0.2% | 8.5% | 163 | 218 | 117 | 29825 | 8.30% | 5.3% | $92,894 | $48,974 | $338,437 | $341,236 | 3.5 |
| 15 | Repentigny | QC | 18% | 43% | 175 | 175 | 1.3% | 63 | 1.9% | 0.2% | 4.4% | 160 | 201 | 108 | 85796 | 1.60% | 4.7% | $82,556 | $44,939 | $419,604 | $330,976 | 3.67 |
| 16 | Tecumseh | ON | 15% | 46% | 998 | 868 | 1.6% | 114 | 1.0% | 0.4% | 0.6% | 150 | 249 | 139 | 24277 | 2.20% | 6.5% | $102,159 | $64,093 | $815,306 | $426,474 | 3.62 |
| 17 | Sherbrooke | QC | 19% | 37% | 190 | 190 | 1.4% | 66 | 3.2% | 0.5% | 3.4% | 187 | 182 | 105 | 171184 | 5.90% | 4.4% | $55,057 | $36,448 | $286,166 | $273,958 | 4.01 |
| 18 | Lévis | QC | 18% | 42% | 190 | 190 | 1.4% | 66 | 2.3% | 0.4% | 3.5% | 175 | 195 | 94 | 147103 | 3.10% | 5.0% | $80,137 | $47,714 | $382,895 | $301,261 | 3.33 |
| 19 | Mirabel | QC | 20% | 48% | 175 | 175 | 1.7% | 60 | 1.6% | 0.3% | 2.3% | 167 | 199 | 112 | 56984 | 18.90% | 4.7% | $83,109 | $42,958 | $359,824 | $389,970 | 4.48 |
| 20 | Terrebonne | QC | 20% | 48% | 175 | 175 | 1.5% | 59 | 1.4% | 0.3% | 4.2% | 166 | 202 | 111 | 116810 | 4.70% | 4.7% | $84,870 | $44,447 | $367,854 | $336,938 | 3.72 |
| 21 | Petawawa | ON | 27% | 49% | 955 | 1009 | 1.0% | 91 | 2.2% | 1.0% | 0.8% | 170 | 181 | 111 | 18176 | 5.00% | 5.5% | $96,831 | $52,657 | $256,852 | $311,651 | 3.08 |
| 22 | Clarence-Rockland | ON | 19% | 44% | 955 | 1009 | 1.2% | 89 | 1.7% | 0.2% | 4.1% | 155 | 200 | 113 | 25317 | 3.70% | 5.1% | $97,551 | $56,560 | $444,912 | $369,372 | 3.51 |
| 23 | Rosemère | QC | 16% | 50% | 175 | 175 | 3.1% | 70 | 1.7% | 0.5% | 6.5% | 166 | 202 | 81 | 14169 | -0.70% | 4.7% | $109,680 | $65,973 | $1,002,384 | $451,391 | 3.45 |
| 24 | Prévost | QC | 18% | 43% | 175 | 175 | 2.0% | 65 | 1.1% | 0.3% | 1.7% | 144 | 197 | 103 | 13633 | 6.20% | 4.7% | $84,610 | $50,568 | $465,432 | $300,891 | 3.01 |
| 25 | Sainte-Marthe-sur-le-Lac | QC | 22% | 49% | 175 | 175 | 1.7% | 59 | 1.0% | 0.4% | 9.0% | 169 | 219 | 107 | 19867 | 13.60% | 4.7% | $87,112 | $41,643 | $363,236 | $344,530 | 4.03 |
| 26 | New Tecumseth | ON | 18% | 43% | 1370 | 1130 | 1.7% | 114 | 2.7% | 0.5% | 0.8% | 155 | 216 | 122 | 38504 | 14.70% | 5.0% | $95,385 | $57,797 | $845,233 | $642,416 | 5.75 |
| 27 | Rimouski | QC | 18% | 35% | 190 | 190 | 1.1% | 72 | 3.8% | 0.7% | 0.9% | 167 | 197 | 72 | 50106 | 2.90% | 8.8% | $60,850 | $40,004 | $292,138 | $214,078 | 2.93 |
| 28 | Whitby | ON | 20% | 55% | 1370 | 1130 | 2.0% | 106 | 1.5% | 0.2% | 6.8% | 146 | 239 | 100 | 138563 | 6.70% | 6.4% | $112,416 | $58,133 | $853,148 | $771,442 | 6.33 |
| 29 | Trois-Rivières | QC | 17% | 34% | 190 | 190 | 1.5% | 68 | 2.6% | 0.5% | 1.7% | 161 | 197 | 104 | 138480 | 3.10% | 5.8% | $53,768 | $36,303 | $283,619 | $212,329 | 3.14 |
| 30 | Thames Centre | ON | 16% | 47% | 1229 | 1131 | 1.2% | 120 | 1.0% | 0.2% | 0.3% | 168 | 223 | 123 | 14046 | 5.10% | 5.3% | $102,267 | $62,084 | $861,106 | $513,652 | 4.43 |
| 31 | Chambly | QC | 22% | 48% | 175 | 175 | 2.3% | 57 | 1.8% | 0.4% | 9.1% | 160 | 203 | 108 | 31012 | 11.00% | 5.3% | $91,454 | $48,912 | $410,406 | $389,471 | 3.96 |
| 32 | Bécancour | QC | 19% | 39% | 190 | 190 | 1.1% | 74 | 2.7% | 0.5% | 1.1% | 161 | 197 | 104 | 13525 | 4.20% | 6.5% | $65,794 | $42,824 | $350,183 | $209,663 | 2.72 |
| 33 | Victoriaville | QC | 19% | 36% | 190 | 190 | 1.2% | 72 | 3.4% | 1.0% | 0.7% | 165 | 194 | 100 | 47230 | 3.60% | 6.5% | $55,177 | $37,686 | $315,433 | $195,773 | 2.92 |
| 34 | Middlesex Centre | ON | 20% | 51% | 1229 | 1131 | 1.5% | 129 | 1.2% | 0.2% | 0.6% | 157 | 226 | 125 | 18621 | 7.90% | 5.3% | $117,724 | $67,418 | $1,109,584 | $582,446 | 4.37 |
| 35 | Westmount | QC | 17% | 45% | 175 | 175 | 5.1% | 139 | 8.5% | 1.9% | 10.1% | 163 | 218 | 117 | 21219 | 3.80% | 7.4% | $109,019 | $120,053 | $3,653,100 | $1,600,094 | 6.32 |
| 36 | Châteauguay | QC | 18% | 43% | 175 | 175 | 1.5% | 81 | 1.7% | 0.3% | 7.5% | 163 | 218 | 117 | 51350 | 4.90% | 5.3% | $71,260 | $42,936 | $324,451 | $296,345 | 3.62 |
| 37 | Kingsville | ON | 22% | 43% | 998 | 868 | 1.0% | 107 | 1.9% | 0.3% | 0.3% | 129 | 246 | 124 | 22412 | 2.60% | 6.5% | $84,104 | $49,976 | $605,817 | $388,239 | 4.28 |
| 38 | Mont-Royal | QC | 21% | 55% | 175 | 175 | 3.4% | 130 | 2.4% | 1.3% | 13.0% | 163 | 218 | 117 | 21613 | 6.60% | 7.4% | $118,728 | $92,563 | $2,588,821 | $1,209,586 | 5.99 |
| 39 | North Grenville | ON | 16% | 42% | 955 | 1009 | 1.7% | 79 | 1.6% | 0.2% | 1.0% | 162 | 202 | 111 | 17316 | 7.40% | 5.1% | $100,412 | $55,695 | $575,107 | $372,821 | 3.53 |
| 40 | L’Assomption | QC | 21% | 45% | 175 | 175 | 1.7% | 65 | 1.9% | 0.4% | 2.3% | 137 | 211 | 113 | 23841 | 9.30% | 4.7% | $77,990 | $39,434 | $316,709 | $290,393 | 3.62 |
| 41 | Drummondville | QC | 19% | 36% | 175 | 175 | 1.4% | 69 | 2.4% | 0.6% | 0.9% | 159 | 210 | 109 | 78019 | 4.40% | 6.5% | $54,890 | $36,644 | $274,460 | $239,637 | 3.63 |
| 42 | Essex | ON | 19% | 42% | 998 | 868 | 0.8% | 102 | 2.0% | 0.3% | 0.4% | 134 | 243 | 138 | 20930 | 2.50% | 6.5% | $76,800 | $47,015 | $495,892 | $333,703 | 3.92 |
| 43 | Oak Bay | BC | 16% | 39% | 1260 | 1200 | 3.2% | 113 | 4.3% | 5.2% | 3.9% | 176 | 293 | 86 | 18233 | 1.20% | 3.6% | $106,589 | $82,797 | $2,314,752 | $1,278,880 | 8.23 |
| 44 | Brossard | QC | 18% | 46% | 175 | 175 | 1.8% | 105 | 1.3% | 0.4% | 14.4% | 165 | 206 | 118 | 92347 | 9.40% | 5.3% | $77,110 | $50,626 | $619,834 | $445,786 | 4.45 |
| 45 | Cantley | QC | 21% | 53% | 190 | 190 | 2.3% | 67 | 0.9% | 0.8% | 3.8% | 160 | 203 | 108 | 11469 | 9.10% | 6.4% | $119,037 | $56,292 | $518,258 | $392,102 | 3.34 |
| 46 | Sainte-Marie | QC | 20% | 41% | 190 | 190 | 1.2% | 76 | 2.7% | 0.3% | 0.6% | 156 | 184 | 95 | 14097 | 4.00% | 5.0% | $68,513 | $43,287 | $384,712 | $228,769 | 2.87 |
| 47 | Norfolk County | ON | 17% | 37% | 1497 | 1156 | 0.8% | 122 | 1.9% | 0.2% | 0.4% | 148 | 217 | 122 | 65463 | 1.40% | 4.7% | $73,161 | $48,333 | $604,291 | $435,509 | 5.04 |
| 48 | Whitchurch-Stouffville | ON | 20% | 54% | 1370 | 1130 | 2.1% | 111 | 1.3% | 0.3% | 3.8% | 165 | 221 | 119 | 51376 | 16.50% | 6.4% | $111,059 | $67,721 | $2,410,521 | $2,263,573 | 16.04 |
| 49 | Markham | ON | 16% | 58% | 1370 | 1130 | 1.8% | 112 | 1.0% | 0.2% | 7.9% | 165 | 221 | 119 | 356416 | 7.20% | 6.4% | $94,086 | $61,170 | $1,594,766 | $1,407,357 | 11.4 |
| 50 | Notre-Dame-de-l’ële-Perrot | QC | 17% | 54% | 175 | 175 | 1.6% | 76 | 0.4% | 0.3% | 3.6% | 151 | 212 | 113 | 10798 | 0.40% | 5.3% | $110,189 | $56,087 | $756,157 | $518,725 | 4.57 |
| 51 | Kingston | ON | 17% | 37% | 955 | 1009 | 1.6% | 106 | 5.2% | 1.4% | 5.3% | 159 | 223 | 99 | 135220 | 4.50% | 5.5% | $73,007 | $47,840 | $573,435 | $427,733 | 4.66 |
| 52 | Wilmot | ON | 20% | 47% | 1495 | 1139 | 1.6% | 113 | 1.9% | 0.4% | 0.5% | 128 | 210 | 117 | 22017 | 7.60% | 5.0% | $103,877 | $58,993 | $902,570 | $690,726 | 6.15 |
| 53 | Haldimand County | ON | 17% | 43% | 1497 | 1156 | 0.8% | 124 | 2.0% | 0.1% | 0.5% | 153 | 245 | 117 | 47635 | 3.70% | 4.7% | $84,225 | $52,322 | $629,581 | $487,655 | 5.21 |
| 54 | Pincourt | QC | 18% | 50% | 175 | 175 | 1.8% | 92 | 1.1% | 0.5% | 4.0% | 151 | 212 | 113 | 14989 | 2.40% | 5.3% | $86,514 | $44,503 | $429,001 | $404,898 | 4.48 |
| 55 | St. Clair | ON | 16% | 40% | 1229 | 1131 | 0.9% | 116 | 1.3% | 0.3% | 0.3% | 138 | 234 | 129 | 14488 | -0.80% | 6.5% | $96,981 | $63,395 | $523,174 | $327,983 | 2.84 |
| 56 | Clarington | ON | 19% | 50% | 955 | 1009 | 1.5% | 96 | 1.4% | 0.2% | 3.2% | 146 | 219 | 111 | 101237 | 10.00% | 6.4% | $104,053 | $53,243 | $725,079 | $677,003 | 6.16 |
| 57 | Halton Hills | ON | 18% | 54% | 1370 | 1130 | 1.9% | 117 | 2.0% | 0.3% | 2.5% | 139 | 196 | 120 | 65236 | 4.40% | 6.4% | $115,963 | $65,571 | $1,300,762 | $1,182,809 | 8.78 |
| 58 | Loyalist | ON | 20% | 39% | 955 | 1009 | 1.1% | 102 | 1.4% | 0.1% | 1.7% | 147 | 239 | 103 | 17817 | 3.50% | 5.5% | $88,438 | $57,148 | $550,306 | $414,598 | 3.94 |
| 59 | Salmon Arm | BC | 19% | 34% | 1260 | 1200 | 1.5% | 108 | 4.0% | 0.5% | 0.8% | 138 | 214 | 105 | 19153 | 8.70% | 5.3% | $76,048 | $45,436 | $711,346 | $428,517 | 5.11 |
| 60 | Bradford West Gwillimbury | ON | 20% | 55% | 1370 | 1130 | 1.8% | 101 | 2.1% | 0.2% | 3.1% | 182 | 201 | 112 | 41055 | 22.90% | 5.0% | $103,029 | $57,911 | $847,902 | $861,916 | 7.38 |
| 61 | Saint-Colomban | QC | 22% | 50% | 175 | 175 | 1.4% | 66 | 0.9% | 0.2% | 1.5% | 144 | 197 | 103 | 17717 | 17.50% | 4.7% | $87,035 | $42,990 | $363,436 | $369,584 | 4.25 |
| 62 | Richmond Hill | ON | 16% | 59% | 1370 | 1130 | 2.1% | 107 | 1.3% | 0.2% | 7.6% | 165 | 221 | 119 | 209207 | 5.50% | 6.4% | $93,500 | $58,385 | $1,486,850 | $1,317,026 | 11.05 |
| 63 | Colwood | BC | 17% | 42% | 1260 | 1200 | 1.4% | 102 | 1.8% | 2.1% | 4.3% | 149 | 347 | 57 | 17672 | 5.60% | 3.6% | $103,632 | $53,740 | $766,527 | $785,223 | 7.39 |
| 64 | Amos | QC | 20% | 37% | 190 | 190 | 1.1% | 64 | 6.7% | 0.4% | 0.3% | 151 | 162 | 74 | 13089 | 0.90% | 3.6% | $68,615 | $47,692 | $287,802 | $224,427 | 2.59 |
| 65 | Boisbriand | QC | 18% | 48% | 175 | 175 | 1.9% | 60 | 3.0% | 0.4% | 4.0% | 166 | 202 | 111 | 27902 | 2.10% | 4.7% | $77,514 | $45,189 | $374,075 | $313,662 | 3.49 |
| 66 | Newmarket | ON | 18% | 54% | 1370 | 1130 | 2.2% | 108 | 2.3% | 0.3% | 4.9% | 130 | 211 | 107 | 89272 | 4.30% | 6.4% | $102,782 | $57,495 | $956,210 | $879,204 | 7.45 |
| 67 | Rothesay | NB | 17% | 44% | 868 | 716 | 1.5% | 110 | 2.2% | 0.1% | 0.8% | 158 | 198 | 75 | 11897 | 1.40% | 6.6% | $93,778 | $71,022 | $999,754 | $402,809 | 2.99 |
| 68 | Quispamsis | NB | 20% | 51% | 868 | 716 | 2.0% | 108 | 1.2% | 0.1% | 0.8% | 166 | 197 | 102 | 18653 | 3.50% | 6.6% | $107,885 | $60,857 | $543,548 | $324,713 | 2.72 |
| 69 | Lakeshore | ON | 18% | 50% | 998 | 868 | 1.0% | 97 | 0.9% | 0.3% | 0.4% | 150 | 249 | 139 | 37624 | 3.50% | 6.5% | $103,168 | $58,643 | $748,652 | $442,988 | 4.08 |
| 70 | Hamilton (City) | ON | 17% | 45% | 1497 | 1156 | 1.6% | 104 | 2.1% | 0.5% | 5.0% | 156 | 227 | 120 | 579105 | 5.10% | 4.7% | $76,193 | $48,102 | $625,005 | $595,593 | 6.54 |
| 71 | Ajax | ON | 19% | 56% | 1370 | 1130 | 1.7% | 98 | 1.4% | 0.3% | 9.4% | 146 | 239 | 100 | 132250 | 10.60% | 6.4% | $105,366 | $57,281 | $877,112 | $916,990 | 7.8 |
| 72 | Mont-Saint-Hilaire | QC | 18% | 43% | 175 | 175 | 2.7% | 67 | 1.6% | 0.5% | 5.6% | 155 | 288 | 117 | 18975 | 2.30% | 5.3% | $98,119 | $61,043 | $886,221 | $456,177 | 3.81 |
| 73 | Hanover | MB | 28% | 61% | 651 | 451 | 1.2% | 121 | 1.5% | 0.5% | 0.3% | 111 | 166 | 107 | 16965 | 10.00% | 4.4% | $83,173 | $50,217 | $413,709 | $327,586 | 3.51 |
| 74 | Centre Wellington | ON | 19% | 44% | 1411 | 1204 | 2.2% | 113 | 3.1% | 0.3% | 0.6% | 179 | 208 | 106 | 29565 | 5.60% | 5.0% | $92,275 | $56,195 | $826,223 | $599,783 | 5.54 |
| 75 | Weyburn | SK | 22% | 40% | 845 | 650 | 1.3% | 103 | 2.9% | 0.8% | 0.5% | 136 | 169 | 110 | 11795 | 4.50% | 4.7% | $85,357 | $68,998 | $880,193 | $287,627 | 2.31 |
| 76 | Rouyn-Noranda | QC | 18% | 38% | 190 | 190 | 1.2% | 68 | 5.6% | 0.4% | 0.9% | 183 | 163 | 83 | 42634 | 1.40% | 3.6% | $69,936 | $42,986 | $263,686 | $226,583 | 2.82 |
| 77 | Taché | MB | 24% | 55% | 651 | 451 | 1.3% | 109 | 1.3% | 0.2% | 0.6% | 112 | 165 | 102 | 12574 | 11.10% | 4.4% | $103,200 | $56,691 | $467,456 | $363,480 | 3.36 |
| 78 | Central Elgin | ON | 15% | 42% | 1229 | 1131 | 1.3% | 111 | 1.6% | 0.3% | 0.2% | 159 | 230 | 128 | 13089 | 1.40% | 5.3% | $97,205 | $57,845 | $671,281 | $397,863 | 3.71 |
| 79 | Beloeil | QC | 20% | 42% | 175 | 175 | 2.2% | 65 | 2.1% | 0.6% | 4.0% | 155 | 206 | 117 | 23415 | 6.50% | 5.3% | $84,809 | $47,979 | $439,803 | $341,477 | 3.65 |
| 80 | Guelph | ON | 18% | 46% | 1495 | 1139 | 2.0% | 101 | 3.8% | 1.1% | 5.1% | 167 | 206 | 113 | 141125 | 8.10% | 5.0% | $85,416 | $49,697 | $683,821 | $678,849 | 6.82 |
| 81 | Orangeville | ON | 20% | 49% | 1370 | 1130 | 1.6% | 92 | 4.1% | 0.5% | 1.6% | 151 | 195 | 105 | 31005 | 6.70% | 5.0% | $94,270 | $49,633 | $598,501 | $661,866 | 6.58 |
| 82 | Niagara Falls | ON | 17% | 40% | 1497 | 1156 | 1.1% | 103 | 2.0% | 0.4% | 1.1% | 171 | 241 | 124 | 91908 | 5.50% | 4.7% | $66,801 | $43,143 | $517,484 | $475,972 | 5.91 |
| 83 | Saint-Basile-le-Grand | QC | 21% | 51% | 175 | 175 | 2.7% | 60 | 1.9% | 0.5% | 9.5% | 160 | 203 | 108 | 17200 | 0.90% | 5.3% | $98,756 | $52,717 | $450,976 | $356,617 | 3.35 |
| 84 | Lincoln | ON | 20% | 45% | 1497 | 1156 | 1.1% | 112 | 1.7% | 0.3% | 0.8% | 163 | 244 | 121 | 24891 | 5.80% | 4.7% | $96,064 | $56,048 | $975,321 | $780,608 | 7.56 |
| 85 | Strathcona County | AB | 19% | 48% | 975 | 870 | 1.6% | 106 | 1.2% | 0.3% | 3.0% | 105 | 162 | 86 | 104433 | 3.60% | 7.3% | $127,368 | $86,276 | $1,082,581 | $543,680 | 3.46 |
| 86 | St. Thomas | ON | 19% | 39% | 1229 | 1131 | 1.1% | 101 | 2.8% | 0.8% | 0.6% | 159 | 230 | 128 | 41108 | 4.40% | 5.3% | $65,079 | $43,370 | $302,991 | $285,748 | 3.56 |
| 87 | Quinte West | ON | 17% | 39% | 955 | 1009 | 0.8% | 110 | 2.0% | 0.4% | 0.6% | 153 | 217 | 118 | 45338 | 2.70% | 5.5% | $72,963 | $45,728 | $405,175 | $358,927 | 4.28 |
| 88 | Carleton Place | ON | 21% | 39% | 955 | 1009 | 1.4% | 93 | 3.6% | 0.5% | 1.3% | 154 | 198 | 117 | 11039 | 6.60% | 5.1% | $79,465 | $49,033 | $425,804 | $349,851 | 3.74 |
| 89 | Niagara-on-the-Lake | ON | 15% | 35% | 1497 | 1156 | 1.6% | 117 | 1.3% | 0.5% | 0.3% | 151 | 238 | 128 | 18652 | 10.90% | 4.7% | $93,425 | $62,754 | $1,255,495 | $738,139 | 6.51 |
| 90 | Amherstburg | ON | 17% | 45% | 998 | 868 | 1.0% | 103 | 1.5% | 0.3% | 0.4% | 134 | 243 | 138 | 23283 | 5.10% | 6.5% | $93,324 | $53,515 | $576,648 | $390,750 | 3.88 |
| 91 | Woolwich | ON | 23% | 50% | 1495 | 1139 | 1.7% | 108 | 3.8% | 0.8% | 0.6% | 169 | 209 | 118 | 27083 | 9.10% | 5.0% | $108,938 | $74,307 | $1,300,121 | $766,279 | 5.47 |
| 92 | Mascouche | QC | 20% | 46% | 175 | 175 | 1.6% | 60 | 1.2% | 0.1% | 3.2% | 158 | 205 | 118 | 50265 | 9.40% | 4.7% | $84,514 | $44,154 | $338,301 | $335,257 | 3.74 |
| 93 | Erin | ON | 14% | 48% | 1411 | 1204 | 1.9% | 131 | 1.8% | 0.2% | 1.2% | 151 | 195 | 105 | 11939 | 5.20% | 5.0% | $117,135 | $68,943 | $1,259,442 | $932,696 | 6.99 |
| 94 | Calgary | AB | 19% | 48% | 1100 | 1030 | 1.9% | 102 | 3.2% | 1.1% | 9.7% | 112 | 171 | 87 | 1372193 | 10.00% | 7.9% | $98,309 | $72,258 | $838,640 | $540,492 | 4.09 |
| 95 | Caledon | ON | 17% | 57% | 1370 | 1130 | 1.8% | 115 | 1.3% | 0.1% | 1.7% | 151 | 195 | 105 | 77337 | 16.40% | 6.4% | $123,673 | $68,082 | $1,404,222 | $1,014,185 | 7.27 |
| 96 | Vaughan | ON | 18% | 61% | 1411 | 1204 | 1.8% | 106 | 1.0% | 0.2% | 6.8% | 137 | 212 | 117 | 330195 | 6.50% | 6.4% | $112,903 | $64,067 | $1,767,338 | $1,474,066 | 11.07 |
| 97 | Terrace | BC | 21% | 40% | 1260 | 1200 | 1.5% | 101 | 5.8% | 2.0% | 0.8% | 207 | 248 | 55 | 11935 | 0.40% | 3.8% | $88,018 | $51,378 | $365,498 | $257,965 | 2.77 |
| 98 | Saint-Bruno-de-Montarville | QC | 18% | 45% | 175 | 175 | 2.7% | 66 | 2.1% | 0.8% | 7.6% | 165 | 206 | 118 | 27203 | 2.60% | 5.3% | $106,066 | $61,484 | $912,912 | $450,700 | 3.68 |
| 99 | Saint-Lambert | QC | 20% | 41% | 175 | 175 | 3.8% | 76 | 2.5% | 1.5% | 13.1% | 165 | 206 | 118 | 22483 | 2.70% | 5.3% | $84,211 | $56,454 | $915,793 | $535,096 | 4.55 |
| 100 | Magog | QC | 17% | 31% | 175 | 175 | 1.2% | 74 | 3.2% | 0.5% | 0.6% | 174 | 198 | 95 | 27566 | 3.80% | 4.4% | $55,784 | $41,832 | $472,120 | $330,852 | 4.39 |
Related Posts

American Carmakers Are Leaving. Bring on the Chinese EVs.
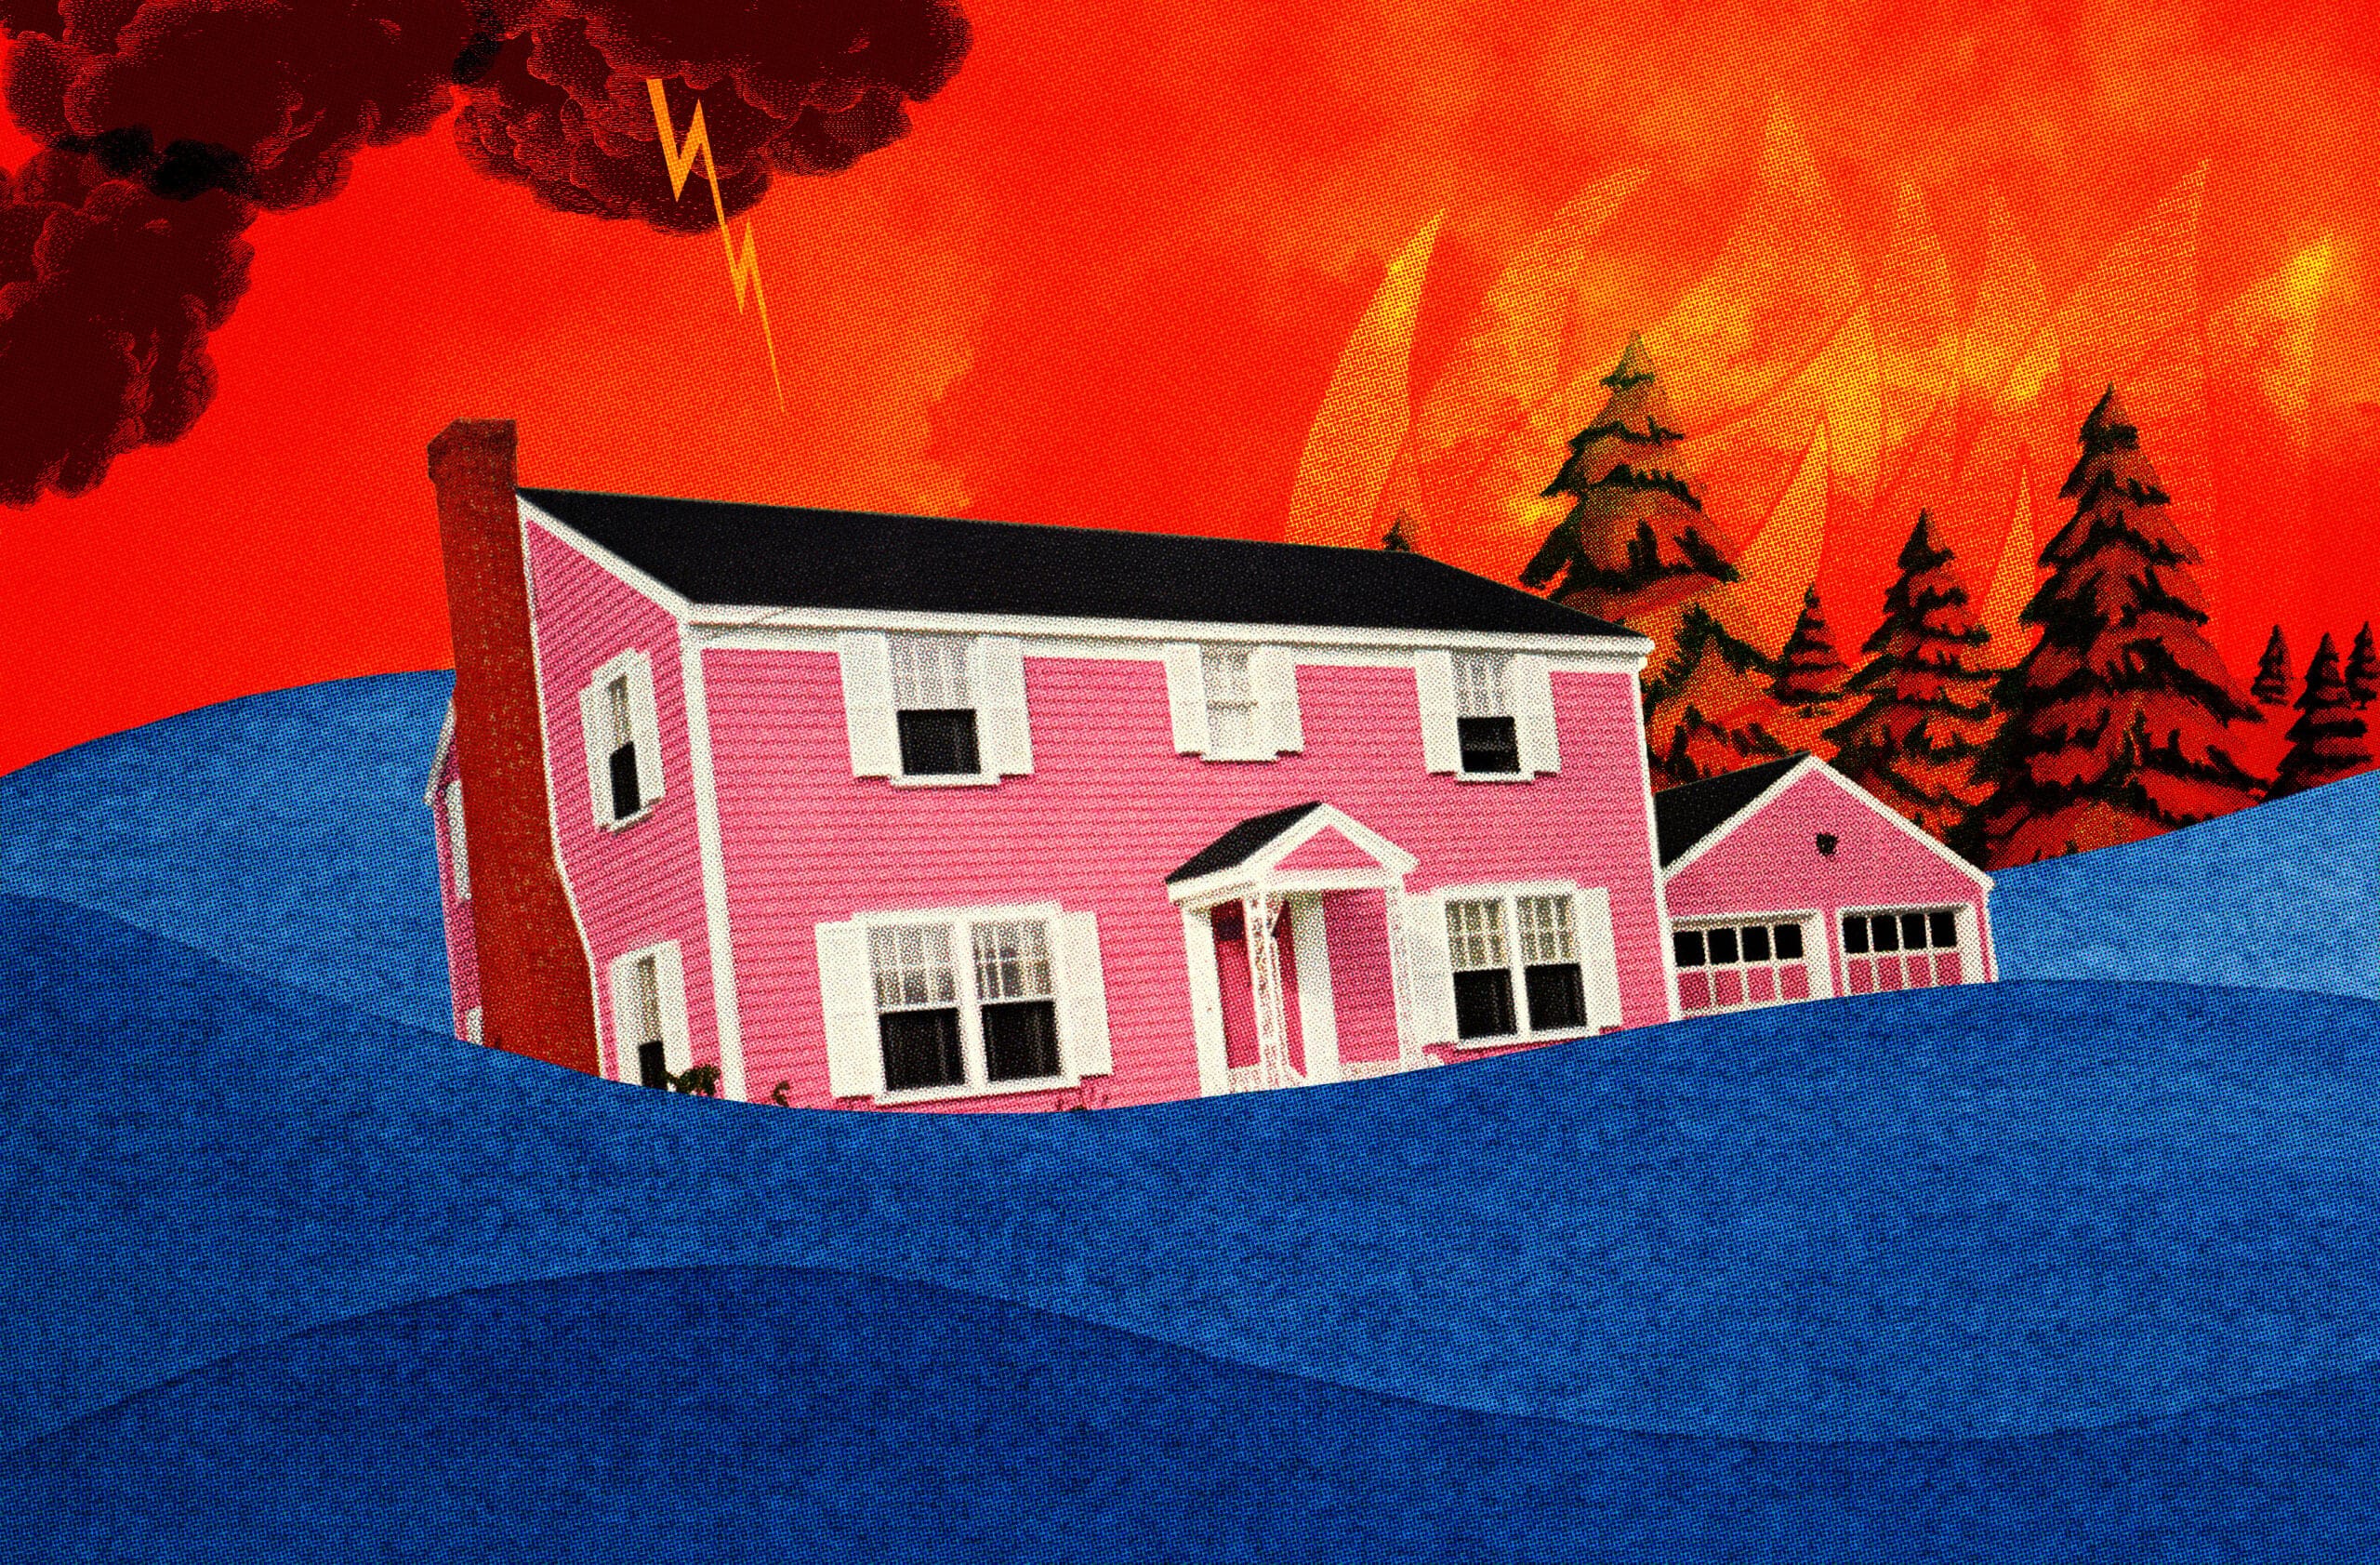
How Do We Keep Canada Insurable?
The Case for Tourist Taxes
Canada Doesn’t Need a New Pipeline
Get the Best of Maclean’s straight to your inbox.
Sign up for news, commentary and analysis. Join 60,000+ Canadian readers.