
Chart: Election expenses? Don’t spend them all in one place.
Every day, Maclean’s Show and Tell infographic series will highlight interesting data in a visually appealing way, bringing clarity and context to some aspect of the campaign—whether it’s one of the election’s major issues, or a less-discussed concern. Read this daily chart series in our special daily “Bulldog” edition. Advertising, professional services, national office expenses and the leader’s tour are the federal election costs that consume the most of a party’s coffers. During the last federal election, Canada’s major parties all spent more than 50 per cent of their funds on advertising. The parties divided the other half differently, however. For example, the Conservatives and Greens spent 12 and 18 per cent, respectively, on “professional services,” whereas the NDP and Liberals spent almost nothing in the category. The NDP and Liberals, however, put more of their resources toward election surveys and research than did the Conservatives and Greens. These figures are from a campaign almost half the length of the current drive. Do you think the 2015 fractions will be similar when the coins are counted after Oct. 19?
Amanda Shendruk is a data visualization expert who turns numbers and spreadsheets into compelling and enlightening information graphics.
Related Posts
Carney’s Biggest National Project is Mythmaking
Alberta Treaty Law Could Decide the Arctic
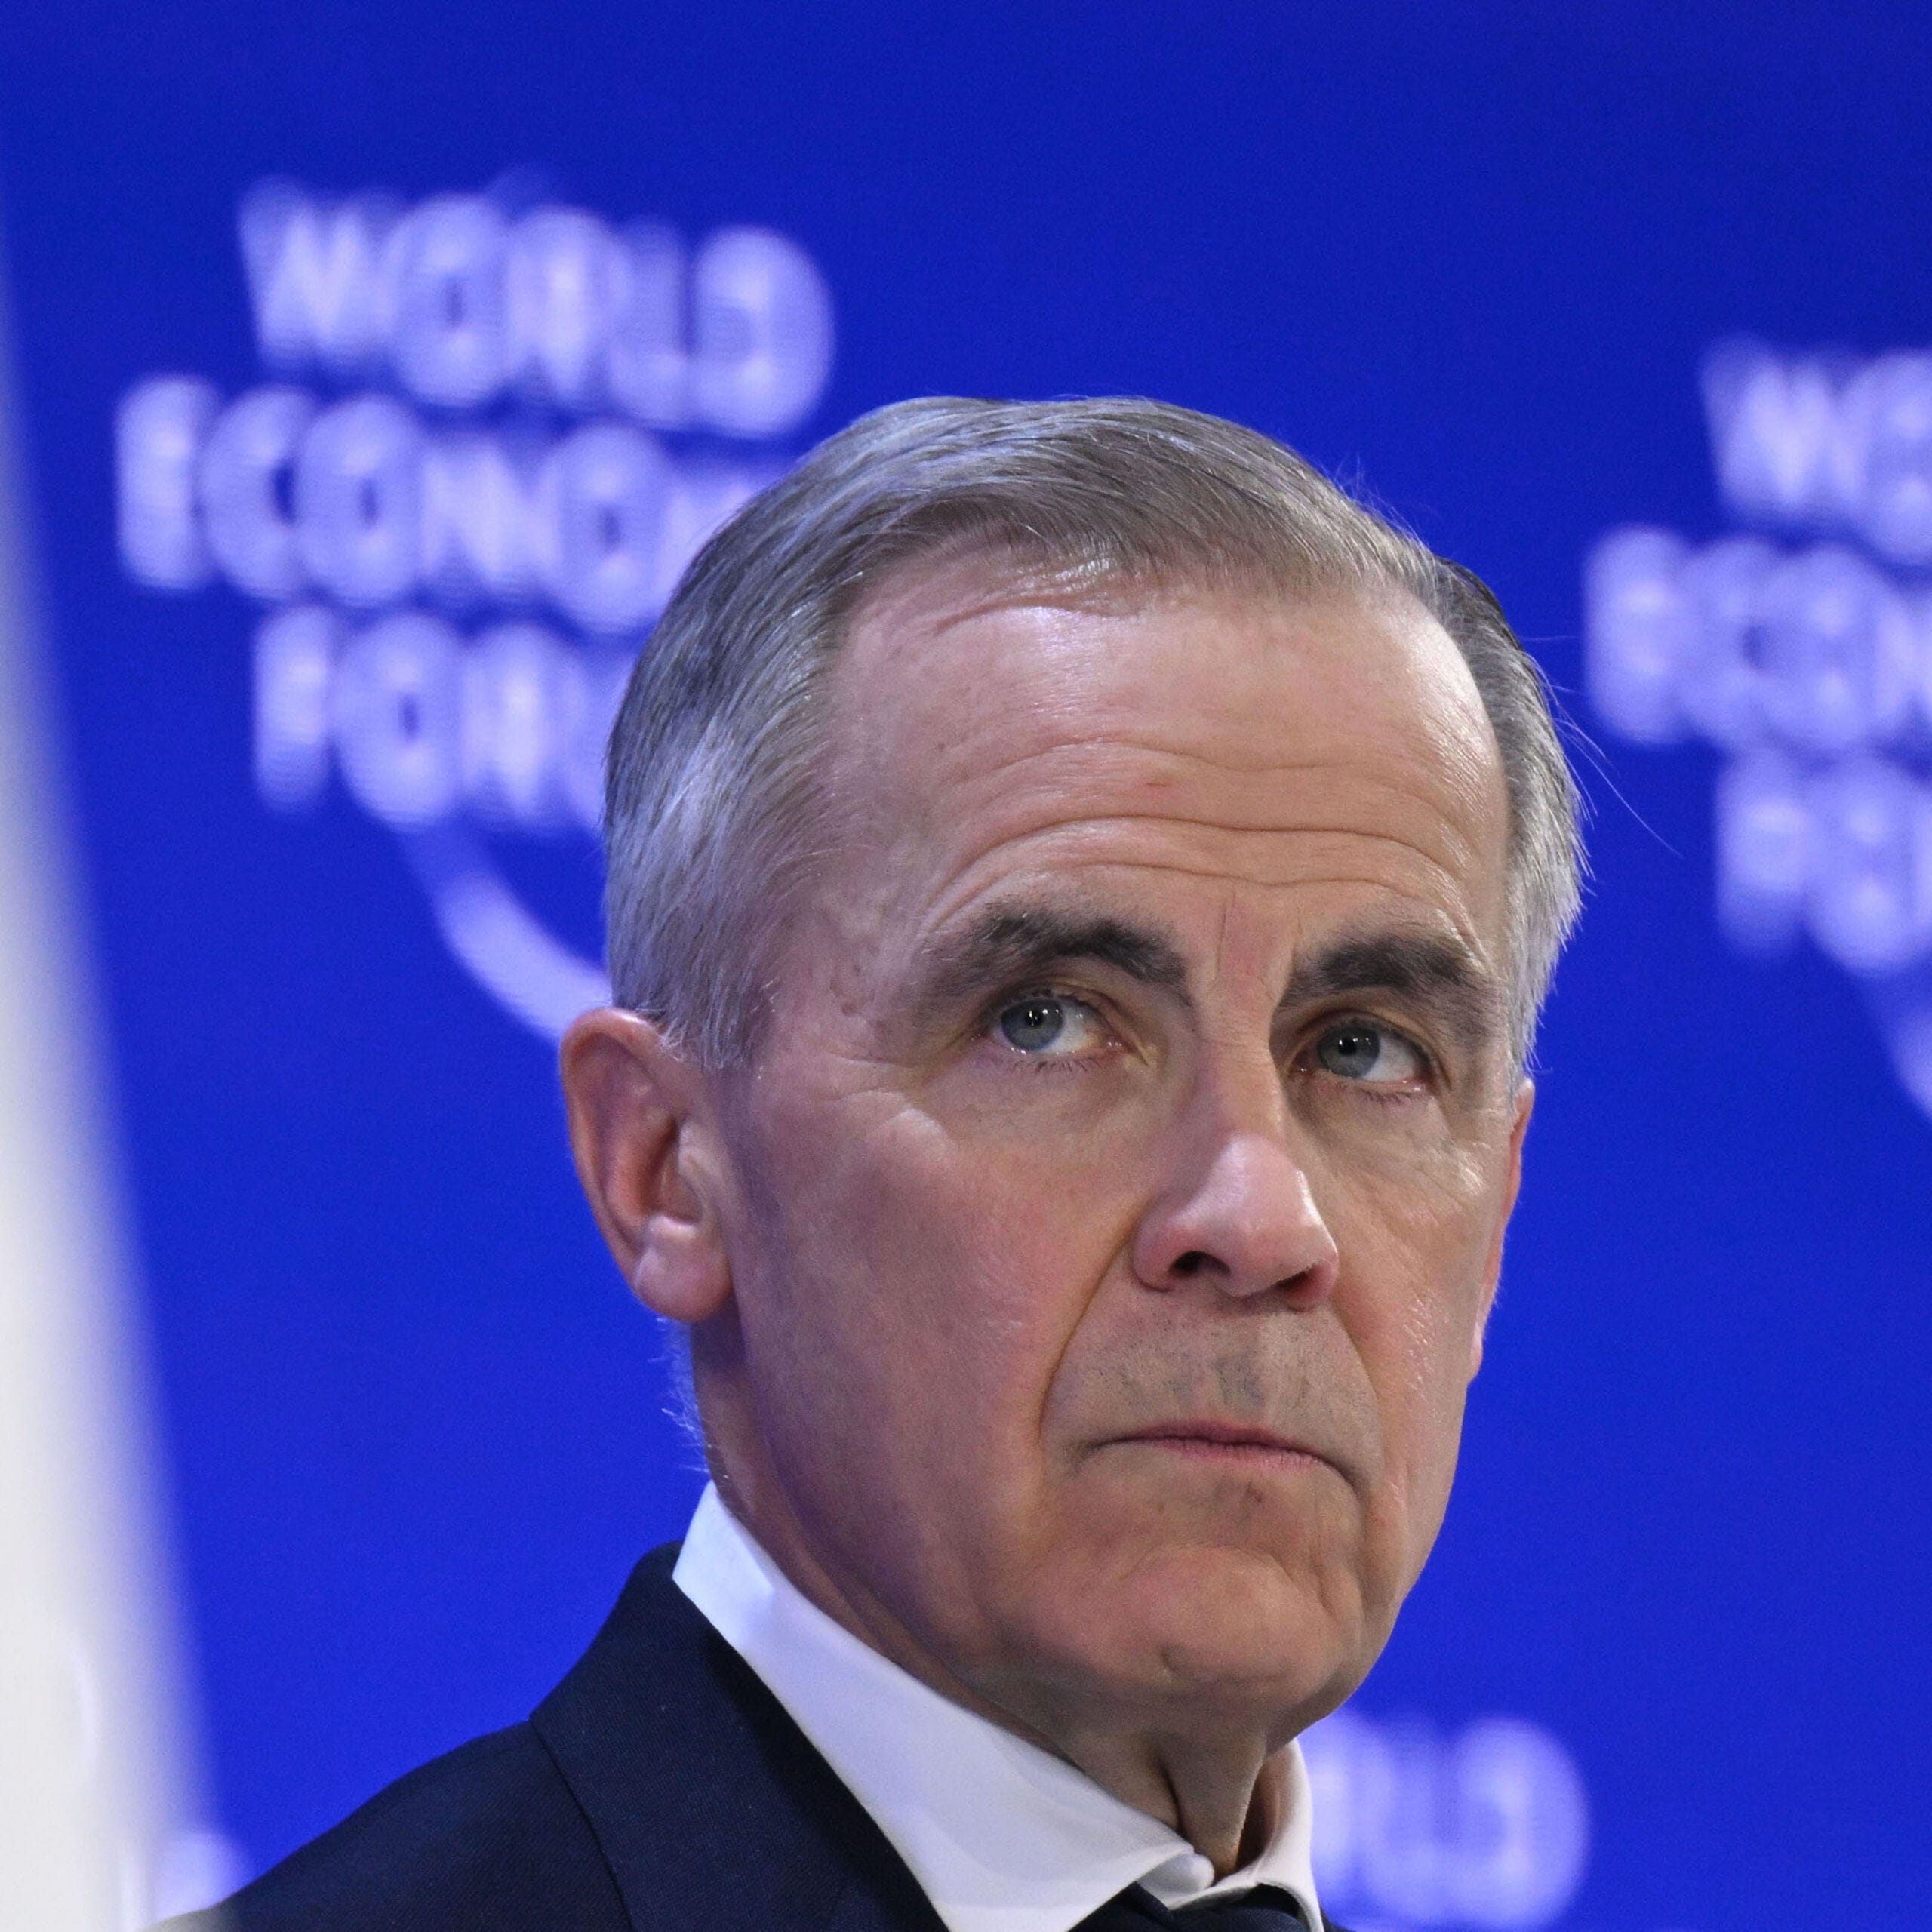
Carney Is the Crisis Manager Canada Needs

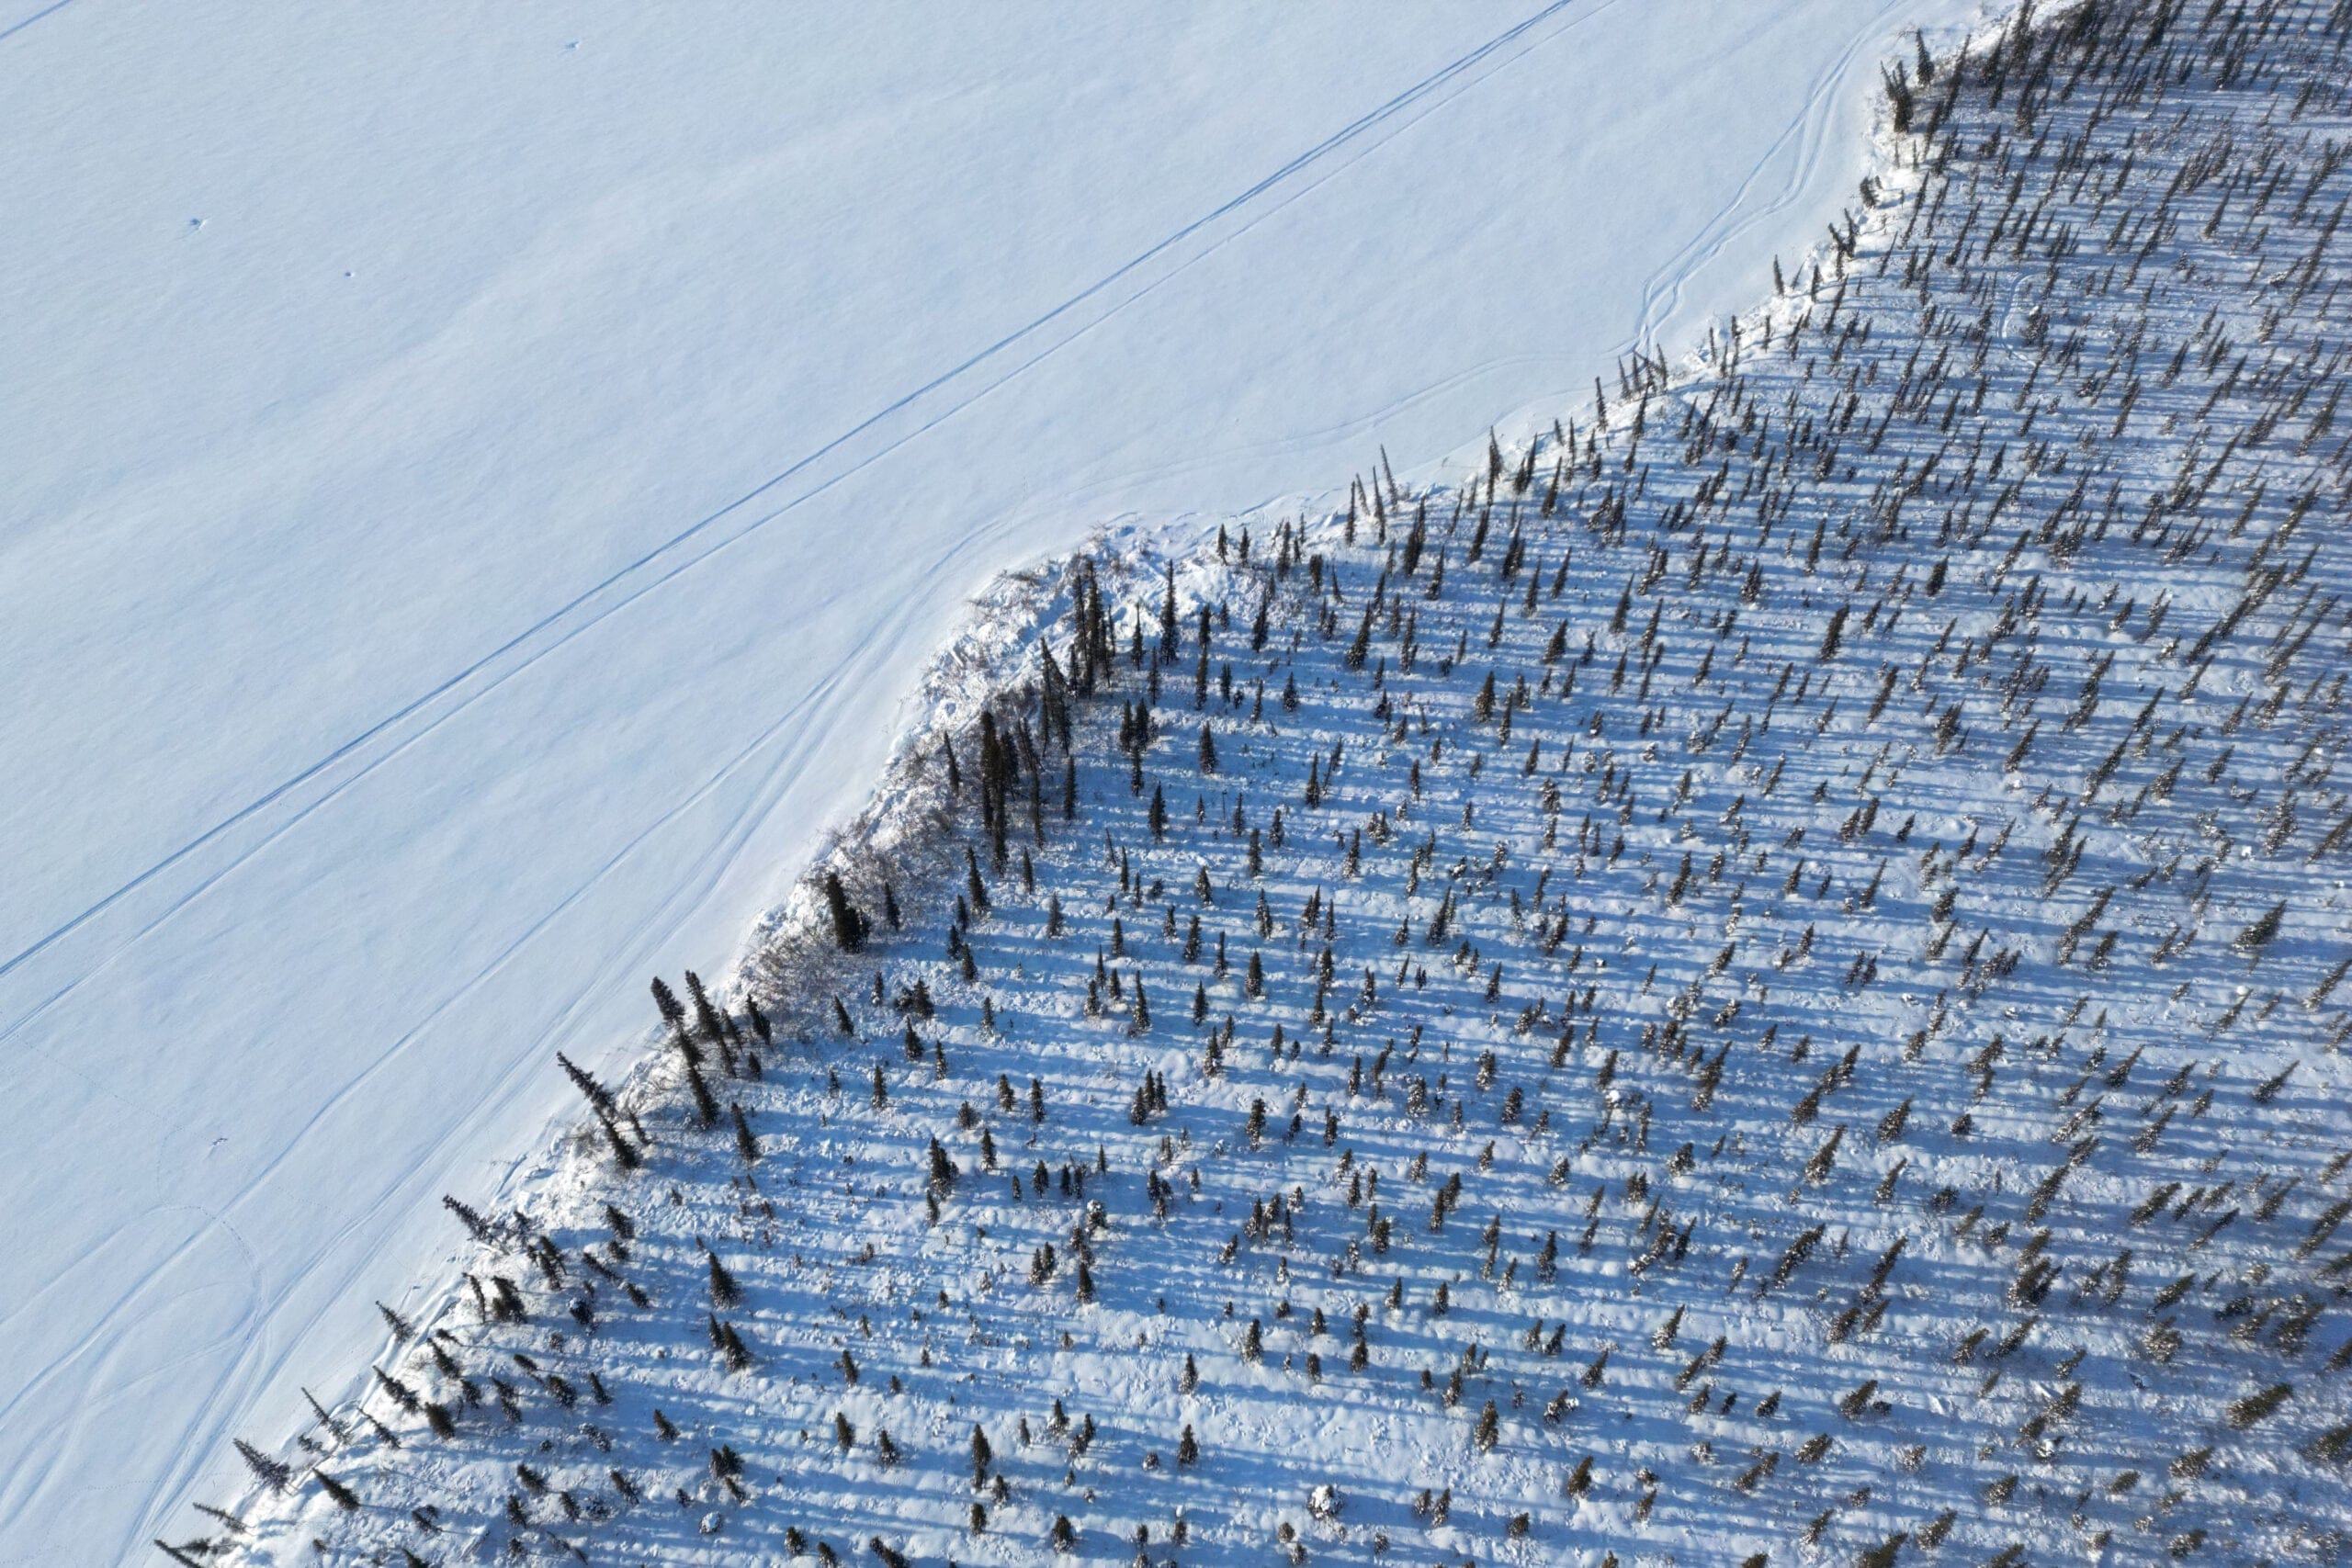
My Adventures in Greenland
Get the Best of Maclean’s straight to your inbox.
Sign up for news, commentary and analysis. Join 60,000+ Canadian readers.