Don’t forget the denominator: Understanding the stats behind your kid’s safety
Media accounts of abductions and accidental child deaths can be alarming. Fortunately, statistics remind us of all those who make it home safe and sound.

iStock
Share
With the 24-hour news cycle and all-encompassing social media, it’s hard not to get swept up in the worst news of the day and want to keep our kids a little closer. The world may seem more dangerous, but is it? How should we put scary stats and figures into perspective?
“You can think in terms of the fraction,” suggests Jeffrey S. Rosenthal, a statistics professor at the University of Toronto and author of Struck by Lightning: The Curious World of Probabilities. “People understand the numerator better than the denominator.” In other words, we get caught up in the details of a story—an abduction, for example—and forget about all the kids (the denominators) who make it home.
In fact, it’s the safest time to be a kid in modern history.
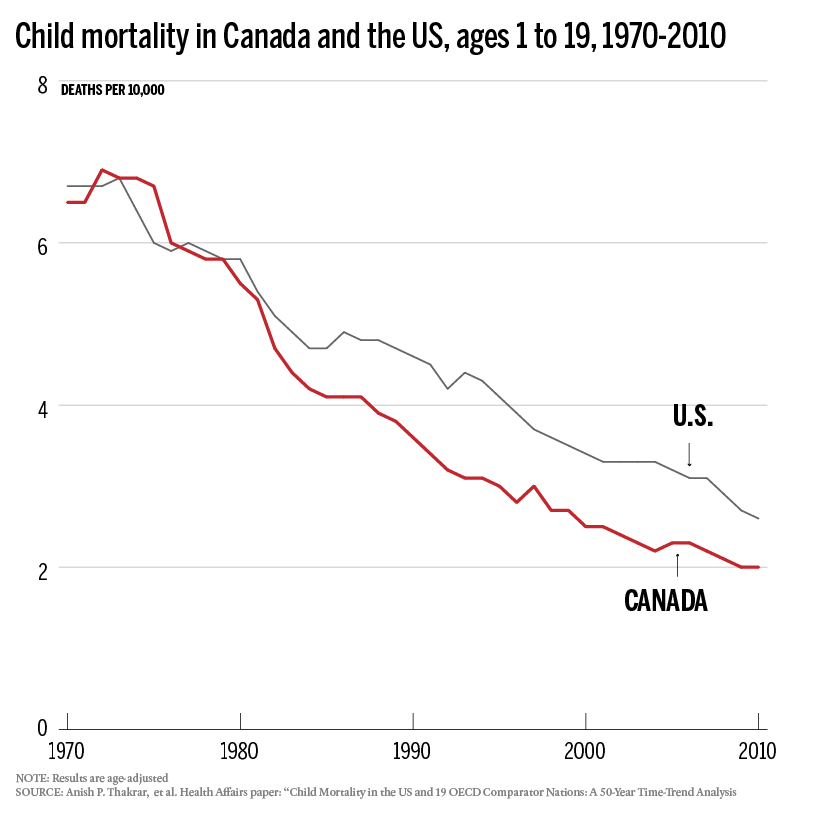
Nearly five decades ago, more than six children from age 1 to 19 died a year out of every 10,000 kids. In 2010, that number decreased to two.
Most kids die by accident
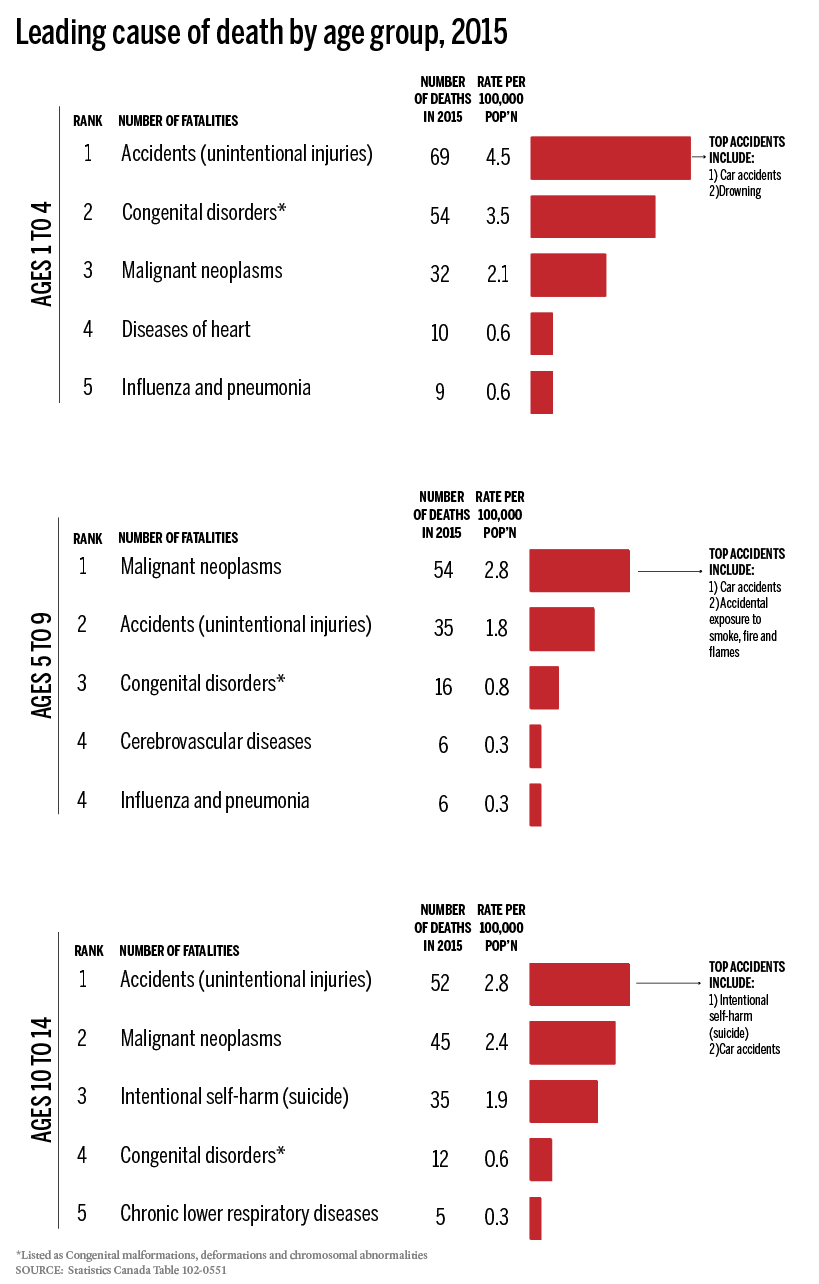
The majority of kids between ages 1 and 14 die in an accident, whether it’s in a car, by drowning or exposure to smoke or fire, among others. Across the country, however, the rate for each age group is less than five children per every 100,000.
Leave Those Kids Alone is a project examining kids and independence, by Today’s Parent and Maclean’s
On the road
The chance of winning Lottery 6/49 is one in 13,983,800. It’s far likelier your kid will be killed in a car accident—in 2014, one out of every 121,400 kids aged 0 to 14 died after being in a collision.
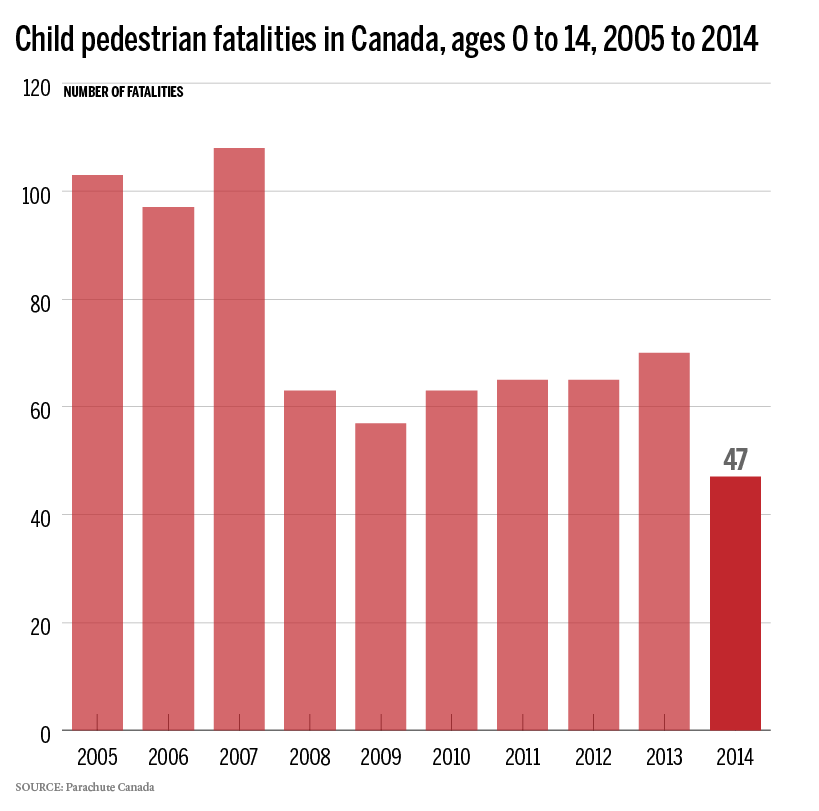
The number of people who die on Canadian roads has been on a steady decline for years, and kids are no different. Whether it comes to getting in a car accident or being struck as a pedestrian, the chances are lower than before. Based on the statistics, however, getting in the car with your kids is one of the riskier things you can do.
When and how kids go missing
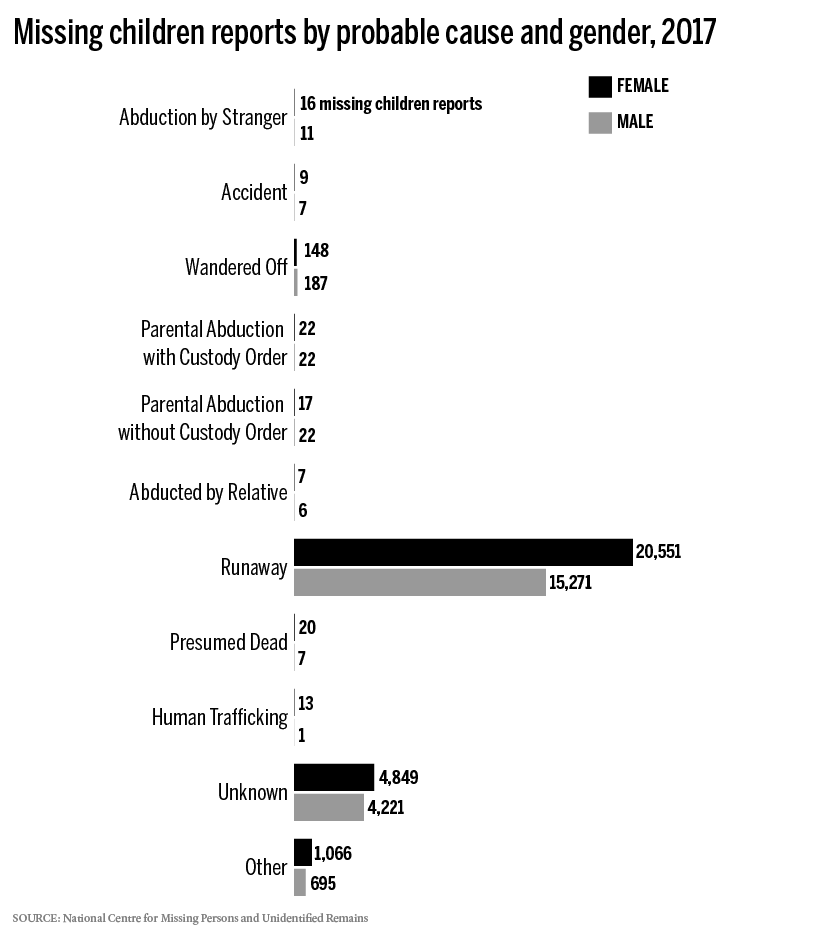
In 2017, one out of every 293,800 kids under age 18 was reported missing on the belief they were abducted by a stranger. The odds are greater than for an average Canadian to be hit by lightning (one in 244,700).
According to the RCMP’s National Centre for Missing Persons and Unidentified Remains, it’s more likely that a child runs away than gets abducted by a stranger.
Regardless why a child disappeared, 61 per cent per cent of all missing children files were removed within 24 hours last year (a removal indicates in the vast majority of cases that the child was found). By one week later, that number increased to 91.
Ending up in the hospital: mental health vs. broken bones
The reason a kid ends up in a hospital varies based on their age.
The top reason newborn babies to four-year-olds ended up in the hospital last year was due to an acute lower respiratory infection, such as bronchiolitis. The second top reason: jaundice.
For kids aged 5 to 9, the highest hospitalization rate was for problems with the appendix. The second top rate was for asthma.
For kids 10 to 14, the top reason was also appendix issues, but the second top hospitalization rate was quite different than the younger kids: “Reaction to severe stress and adjustment disorders.” Last year, there were nearly 1,500 hospital visits for that reason (similar to the other rates, some of these could have repeat visits).
Several mental health issues were in the top 10 reasons for hospitalization. The third most common reason was depression, with more than 1,320 hospitalizations for depressive episodes—more than a broken arm and lower leg put together.


