338Canada: Now for something lighter than politics—NHL projections!
Philippe J. Fournier: Applying the 338Canada model to hockey reveals the Leafs destined for the playoffs, and the Sens in need of a miracle

Leafs right winger Mitch Marner (right) celebrates a goal with teammate Auston Matthews during a game in Toronto on Dec. 23, 2019 (Frank Gunn/CP)
Share
The basic idea for the 338Canada electoral model spawned from a rudimentary Big Bang simulator I was coding for a conference on early universe cosmology, which had been scheduled during the height of the Clinton vs Trump election.
The conference itself was a moderate success among students and peers, but by the end of it my head was light-years away, deeply immersed in this new videogame-like election simulator. I was pulling all-nighters playing around with the parameters, using past election results and demographic data trying to find proper indicators.
After the 2018 Quebec election, I dove into one of my childhood passions: hockey statistics. After the success of Moneyball in the early 2000s, analytics in sports grew in popularity and allowed nerds like me to feel more confident talking and writing about sports. A mild and intermittent Impostor Syndrome had kept me from doing just that until today… and so here is my very first hockey column.
The probability distribution for the number of goals per game per team in the NHL is eerily close to the famous Poisson Distribution. Although I do not wish to bore readers with math and statistics, I would argue that how well this probability function works with hockey results is actually both exciting and astounding.
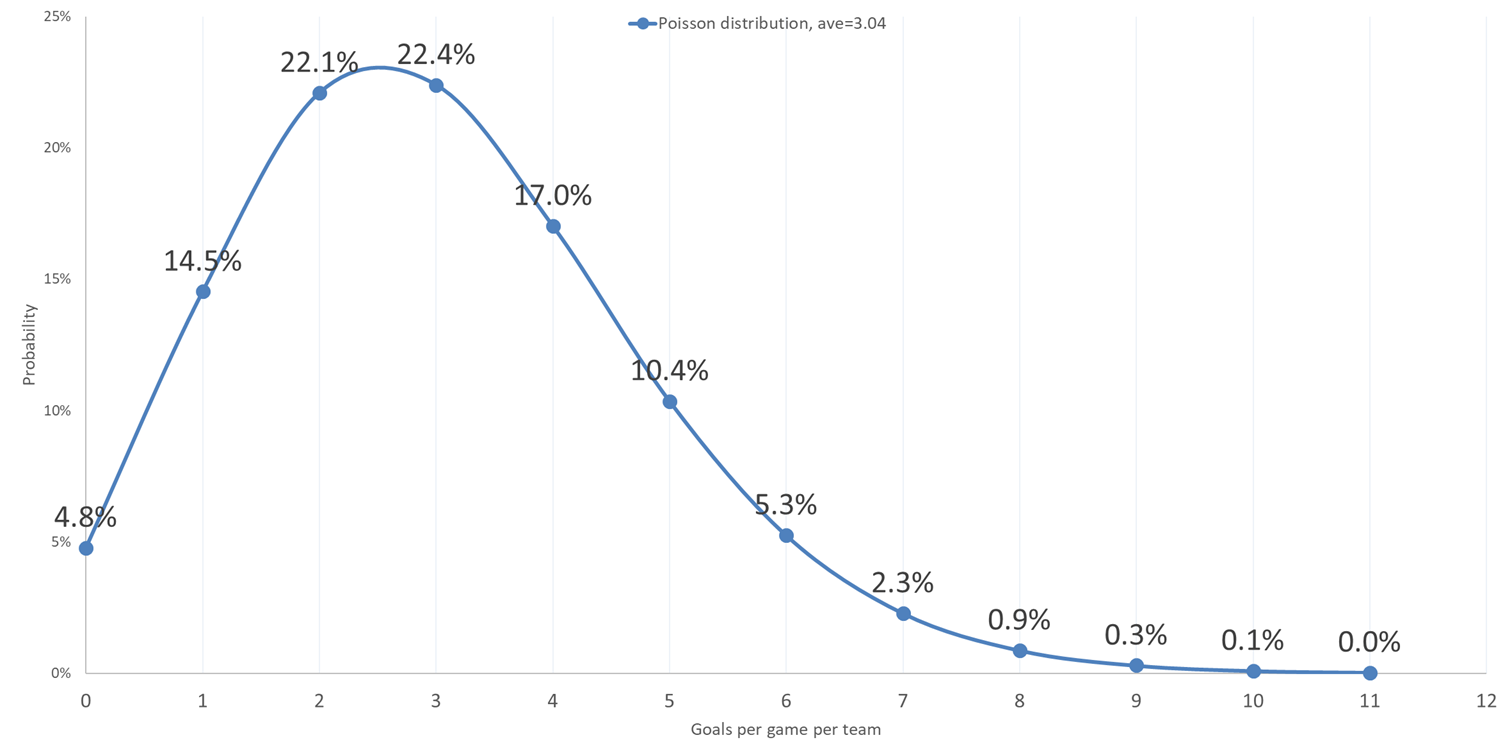
Case in point: There have been 581 regular season NHL games this season (from Oct. 2 to the Christmas break) and so far there have been on average 3.04 goals per game per team. Here is the theoretical Poisson probability function of goals per game per team using this average value:
According to the graph above, the theoretical probability that a team is shut out in a game this season is 4.8 per cent; odds that a team scores only one goal is 14.5 per cent; 22.1 per cent for two goals and so on.
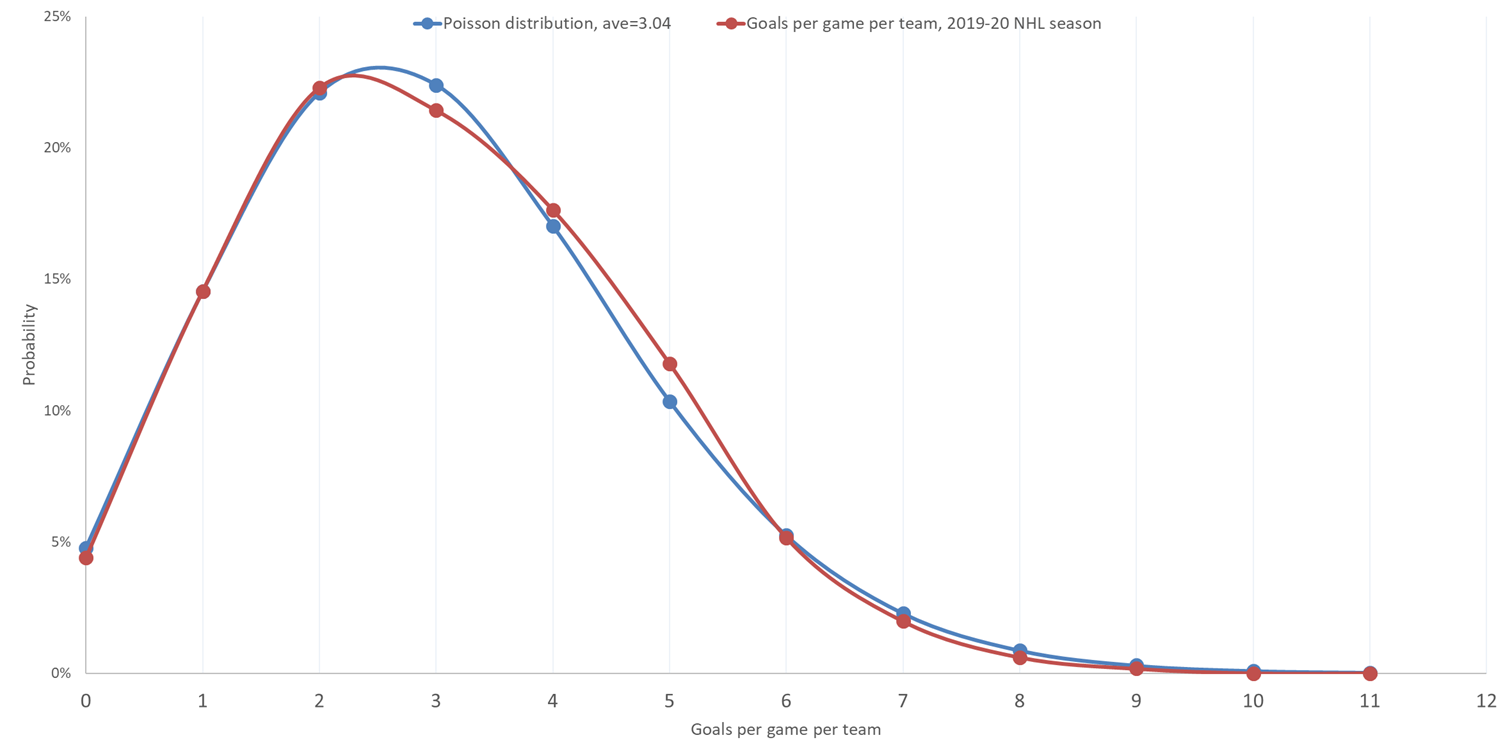
So how does this match actual game results? For the sake of comparison, here is again the theoretical curve in blue and the actual results, in red, after the first 581 games of the current NHL season:
It’s amazingly close.
Naturally, a hockey game cannot be considered a perfect example of a Poisson process. In an ideal Poisson process, each event (in this case, a goal being scored) has to be completely independent from the previous and next event—and in hockey (and sports in general) we simply cannot ignore the very real notion of momentum. In addition, not all goals are scored in similar conditions: a more thorough approach would require a breakdown of the goals scored at even strength, on the powerplay, and on the penalty kill separately (not to mention penalty shots, 3-on-3 overtime, and the shootout).
Nevertheless, a model is always constructed as an approximation of reality, especially when a heavy human element is involved—sports, politics, gaming, etc. The key to building reliable models is to start small, and gradually add more complex variables to test whether they actually improve the output. Otherwise, there is always a risk of adding random and mostly meaningless fluctuations to the results and mistakenly confuse this noise for actual data.
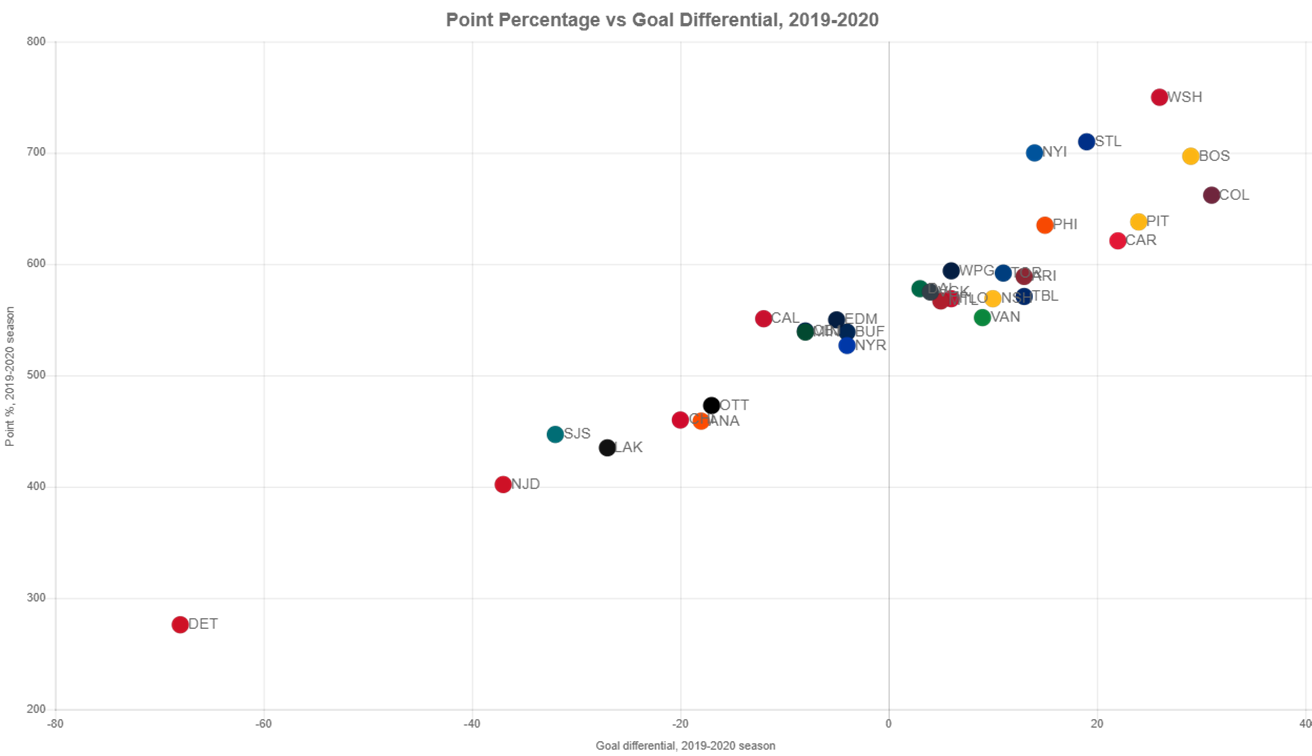
One of the most important indicators of a team’s success (or lack thereof) is the goal differential (goals for minus goal against). Obviously, this variable taken on its own is not perfect (no variable is): Team X could lose 7-0 one night and win the next two games 2-1. After those three games, team X would have a respectable record of 2-1-0, but a poor minus-5 goal differential. However, in the long run, teams with higher goal differentials tend to win more games. Case in point, let’s graph this season’s team point percentages (vertical axis) versus goal differential (horizontal axis):
We see a clear, almost linear, pattern: Teams that score more goals and allow fewer goals earn more points in the standings. This last sentence is not surprising in itself, but the fact that we see this obvious a pattern with only a half-season of data is incredibly telling.
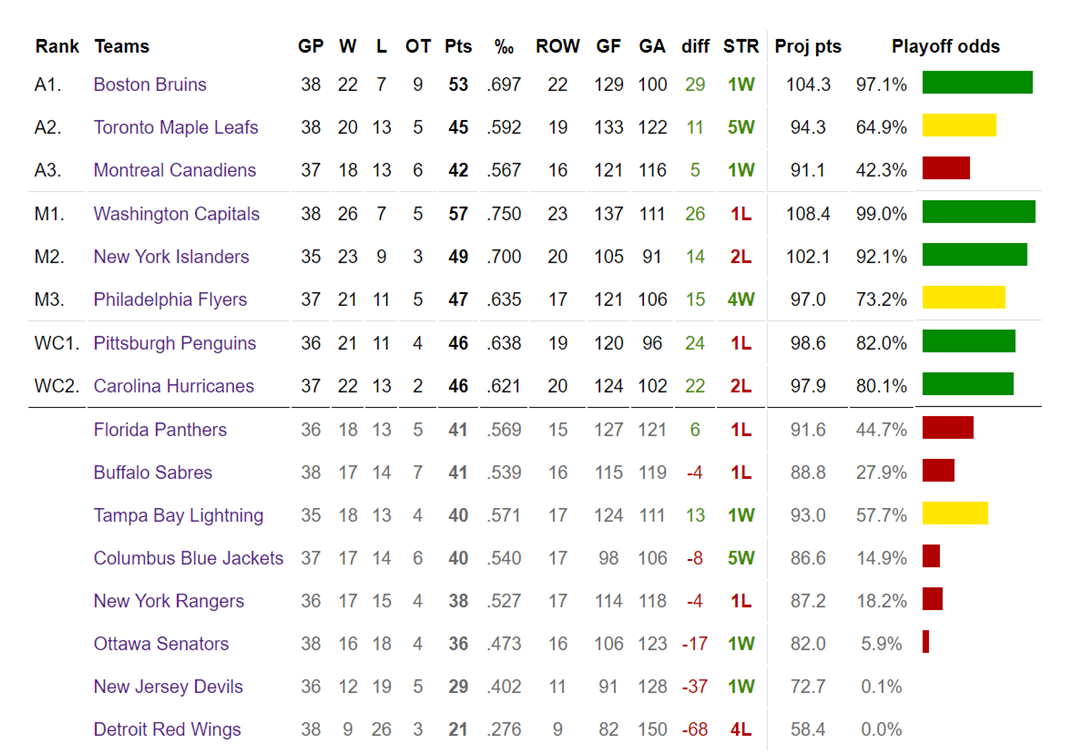
Using this data (and updating it for all 31 teams on a daily basis) and running thousands of simulations of what’s left of the calendar, we can calculate playoff odds and point projections for every team. Here are the eastern conference standings as of the Christmas break with the 338 playoff odds and point projections:
Let’s take a look at the eastern Canadian teams:
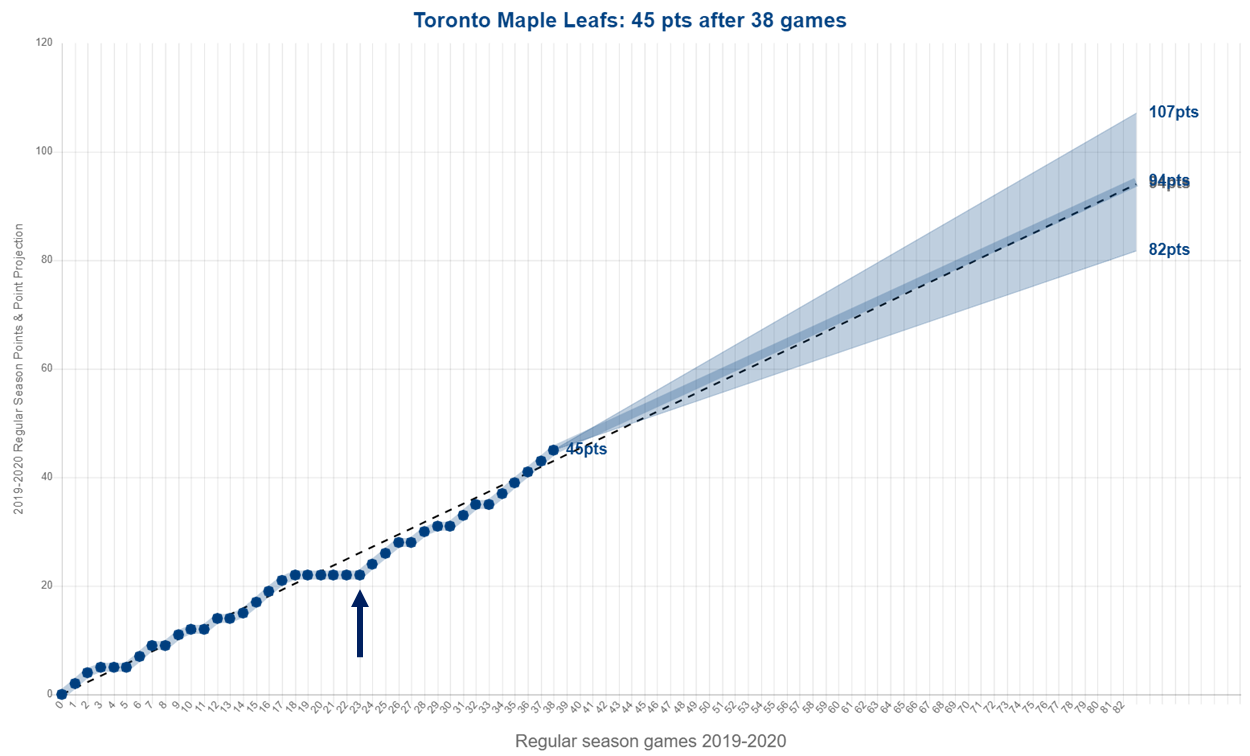
The Toronto Maple Leafs are now projected to finish the season at 94 points (just above the eastern playoff threshold) with a 95 per cent confidence interval of ±12 points. However, considering the Leafs have significantly bounced back from a poor November since the firing of head coach Mike Babcock, it would not be surprising to see this point projection rise in the coming few weeks if the team keeps playing at this new level.
Here is the point progression and projection for the Leafs:
On the graph above, the black dotted line indicates the projected eastern playoff threshold (adjusted daily). The blue arrow indicates Mike Babcock’s last game as Leafs head coach, at which point the Leafs stood below the dotted line and were projected to miss the playoffs.
The graph below shows the projected point total for the Leafs on a daily basis. On the day of Babcock’s firing, the Leafs were projected at an average of 84 points, well outside of the playoff picture.
Over the past month, the Leafs have improved their point projection by 10 points (84 to 94) and are now more likely to make the playoffs than not.
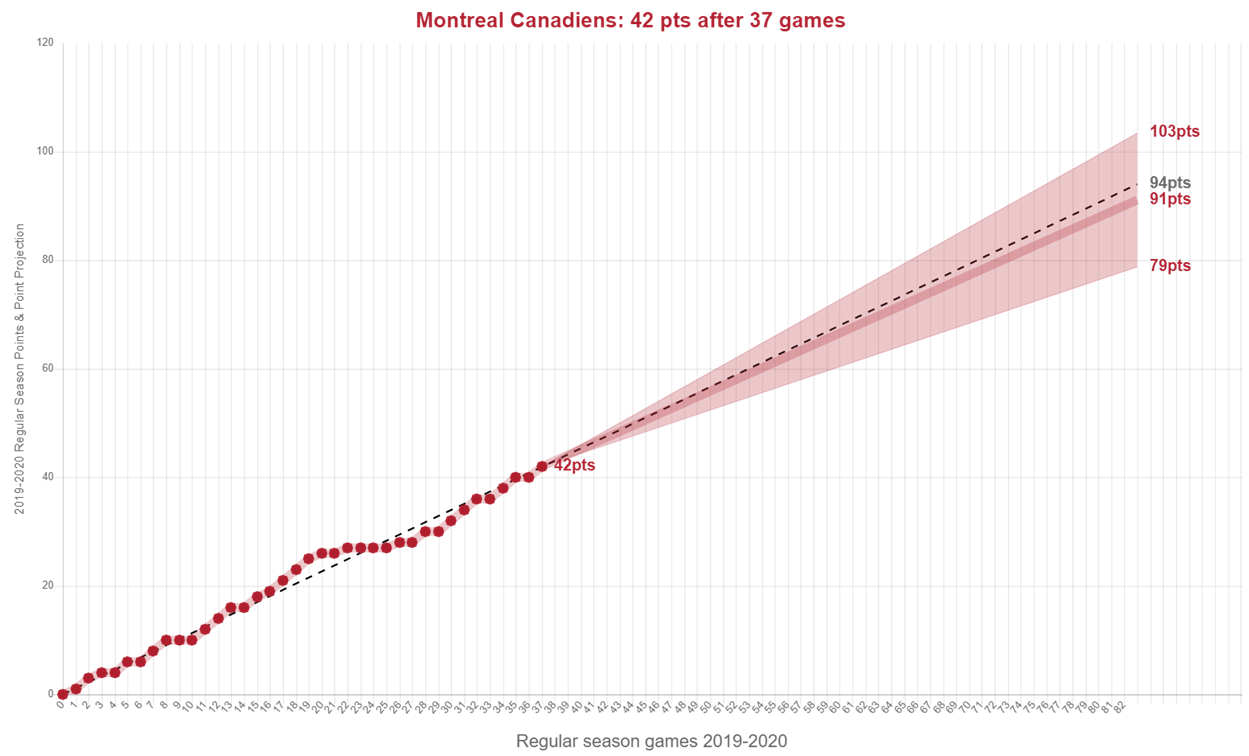
The Montreal Canadiens have been playing inconsistent and average hockey all season so far. Here are the Habs’ point progression and projections. Notice how closely the point progression follows the dotted line:
After a poor November (during which they lost eight straight games), the Habs have picked up the pace and have won three of four in their Western Canadian road trip. As you can see above, the Canadiens are projected at 91 points, just below the eastern playoff threshold.
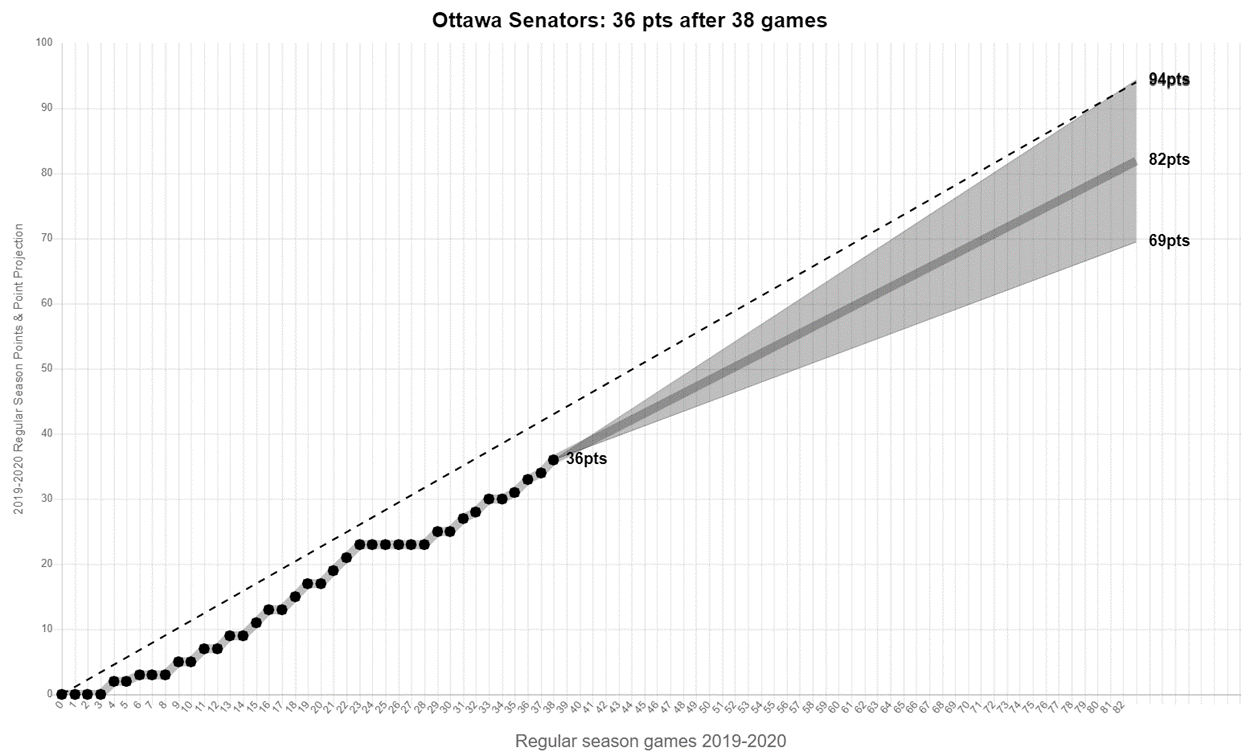
The Ottawa Senators would need a miracle to qualify for the playoffs this season. With only 36 points in 38 games, the Sens are currently projected at 82 points, clearly below the playoff threshold, and have remained below the dotted all season so far:
It would take a dramatic run, similar to the St. Louis Blues last season, for the Sens to make it—especially in a highly competitive Atlantic division: Tampa Bay, Buffalo, Montreal, Florida and Toronto are only separated by five points in the standings as of this writing. With Boston almost locked in for first place, Ottawa would have to leapfrog at last four of those five aforementioned teams to enter the playoffs in April. That is highly unlikely.
We will take a closer look at the western Canadian teams in a future column. For more on the 338 hockey model, visit this page.
